The Fast Break – Victoria
April saw some timely opening rainfall south of Bendigo and east of Ballarat, with particularly heavy falls in west Gippsland. The Mallee and Wimmera are still waiting for a break but it’s still earlier than the average break timing of mid-May. Most soil moisture probes are holding, with the surface quite dry in the north. Some sowing into moisture has occurred in the eastern part of the northeast.
The Pacific Ocean has officially left El Niño status and is firmly in a neutral state. The trade winds, pressure and cloud patterns all point to the atmosphere being neutral. The large slug of cold water at depth in the Pacific has just started to outbreak at the surface at the Ecuadorian coast but the rest of the eastern Pacific Ocean surface remains slightly warm. Most models predict a La Niña to form in winter, but stronger easterly winds along the equator would be needed for this to occur.
The Indian Ocean is delicately poised. Strong warming off east Africa has led to greater cloud and lower pressure in that zone. Off Sumatra, the surface water is normal in temperature, but a lack of cloud looks a bit positive Indian Ocean Dipole (+IOD) like. All of these phenomena while suggestive of +IOD can’t be until the wet season is over in coming weeks. What is significant this month has been the sustained stronger easterly winds in the east Indian Ocean that are very +IOD forming in appearance. If they continue, we expect cooler water to start upwelling off Indonesia and pile further warm water up off Africa.
The Southern Annular Mode (SAM) was weakly positive in the first half of April, but its behaviour has historically had erratic effects in autumn. It is predicted to be fairly benign in the coming fortnight. Many drier forecasts for southwest Victoria could have a predominately positive state of the SAM as their basis.
The Madden Julian Oscillation (MJO) has also spent the first half of April missing in action and is predicted to stay that way for the next month.
Rainfall problems in the west of the state can be squarely blamed on the high-pressure position and strength over the last 30 days. In the month of April, a strong slow moving pressure system south of the Bight has led to blocking behaviour to storm systems to our west. The drier forecast for the southwest may indicate this is predicted to remain for some time. We hope to see pressure move south and decrease in pressure but historically a +IOD has often manifested itself by placing a strong pressure system over the Bight.
My assessment of 12 climate models for Victoria is neutral for rainfall (plan for anything) but half the models predict a likely drier southwest, with likely warmer temperatures for the next three months. Model accuracy is mixed for the next three months.
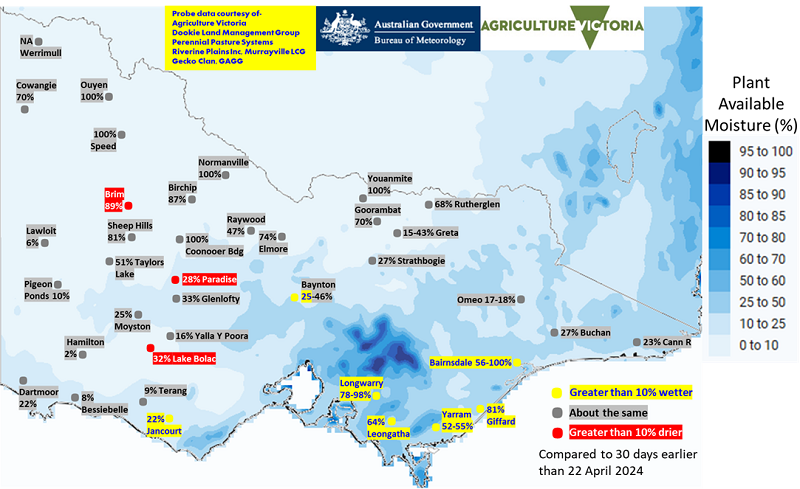
Soil moisture
Compared to 30 days earlier than 22 April 2024
The BoM Australian Water Outlook decile (AWO) models west Gippsland and parts of central and north central Victoria to be wetter. The southwest, surf coast and East Gippsland are drier where other areas are close to normal.
The soil moisture probe network shows the rain in the Otway’s and west Gippsland has wet up profiles. A few paddocks have decreased but most are staying the same. Northern areas remain wet at depth and just need sufficient rain to join up with moisture at depth to be off to a good start. West Gippsland could have a long wet winter, even with average rainfall from on. The Paradise phalaris decreased 16 percentage points from 44 to 28% and the Longwarry perennial ryegrass increased a whopping 70 percentage points from 8 to 78%.
Soil moisture probe data can be accessed in real time at Agriculture Victoria’s soil moisture monitoring website.
Baynton granite annual | 25 |
Giffard crop | 81 |
Jancourt perennial rye | 22 |
Yarram ryegrass | 52 |
Yarram prairie grass | 55 |
Bairnsdale annual | 100 |
| Bairnsdale perennial | 56 |
| Longwarry chicory | 98 |
| Leongatha perennial | 64 |
| Longwarry perennial rye | 78 |
| Taylors Lake crop | 51 |
Goorambat crop | 70 |
Birchip crop | 87 |
Cowangie crop | 70 |
Raywood annual | 47 |
Buchan perennial | 27 |
Rutherglen crop | 68 |
Yalla-Y-Poora crop | 16 |
Lawloit lucern | 6 |
Hamilton crop | 2 |
Greta summer pasture | 15 |
Bessiebelle perennial | 8 |
Coonooer Bridge crop | 100 |
Normanville crop | 100 |
Ouyen crop | 100 |
Sheep Hills crop | 81 |
Speed crop | 100 |
Youanmite crop | 100 |
Pigeon Ponds phalaris | 10 |
Dartmoor lucerne | 22 |
Greta annual pasture | 36 |
Moyston perennial | 25 |
Greta phalaris | 43 |
Strathbogie pasture | 27 |
Glenlofty perennial | 33 |
Omeo perennial | 17 |
Elmore crop | 74 |
| Baynton granite phalaris | 46 |
| Omeo crop | 18 |
Cann River perennial | 23 |
| Terang perennial | 9 |
Lake Bolac crop | 32 |
Paradise perennial | 28 |
Brim crop | 89 |
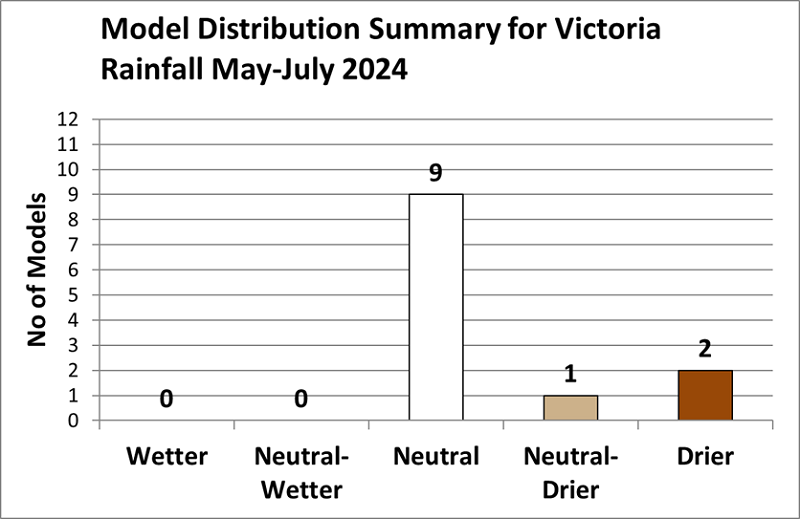
Model distribution summary for the next 3 months
Predicted rainfall – May to July 2024
Predictions for May to July 2024, the outlook from 12 global model forecasts for Victorian rainfall is neutral.
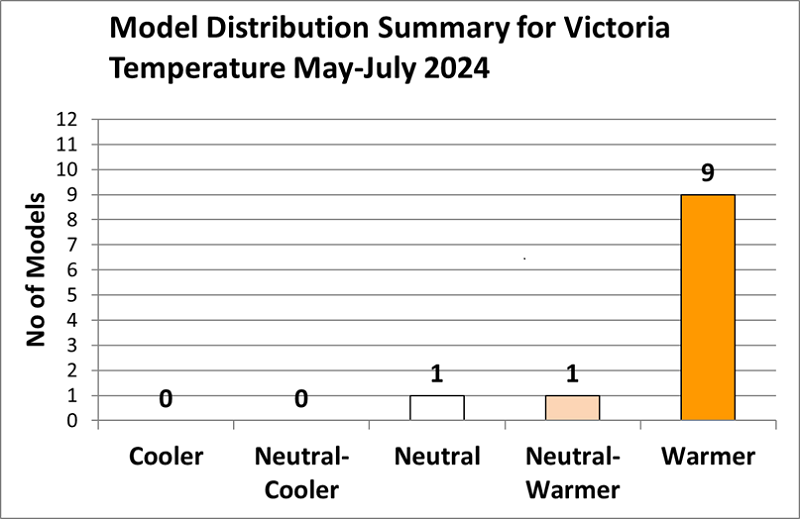
Model distribution summary for Victoria
Predicted temperature – May - July 2024
Predictions for May to July 2024, the outlook from 11 global model forecasts is for likely warmer across Victoria.
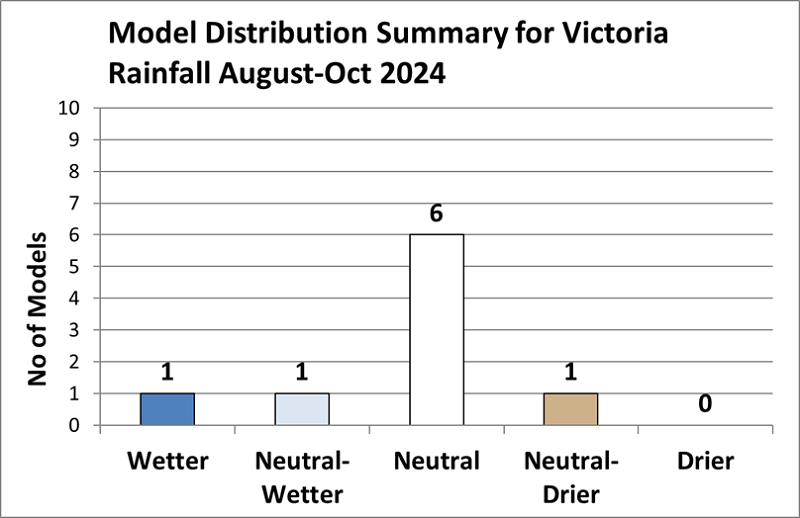
Model distribution summary for the next 4 - 6 months
Predicted rainfall – August to October 2024
Predictions for August to October 2024, the outlook from 9 global model forecasts is neutral over Victoria but with many predictions for a likely drier southwest
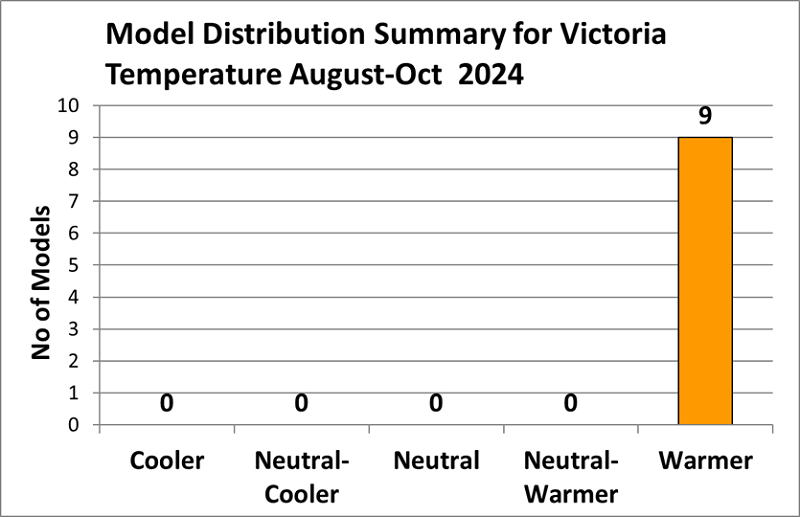
Predicted temperature – August to October 2024
Predictions for August to October 2024, the outlook from 9 global model forecasts is for likely warmer across Victoria.
Model consensus forecast for the next 6 months
Current outlook (23 April)
Phenomena | May-July | August-October |
|---|---|---|
Pacific Ocean | Slightly cool/normal | Cool (La Niña) |
Indian Ocean | Cool (+IOD) | Cool (+IOD) |
Rainfall | Neutral | Neutral |
Temperature | Warmer | Warmer |
Previous outlook (4 April)
Phenomena | April-June | July-September |
|---|---|---|
Pacific Ocean | Mixed | Cool (La Niña) |
Indian Ocean | Slightly warm | Slightly warm |
Rainfall | Neutral | Neutral |
Temperature | Warmer | Warmer |
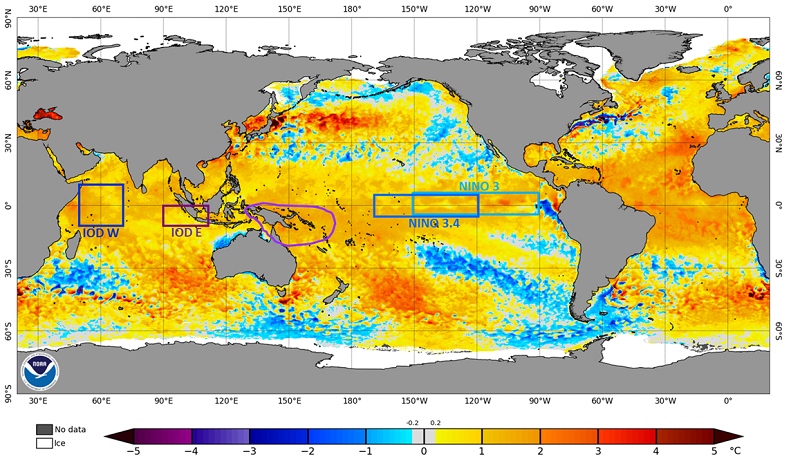
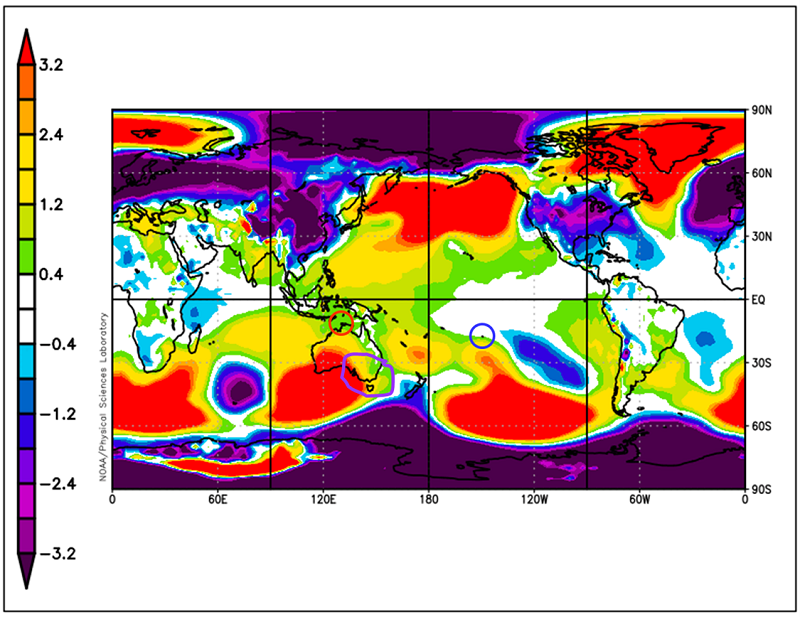
Sea surface temperature (SST) anomalies
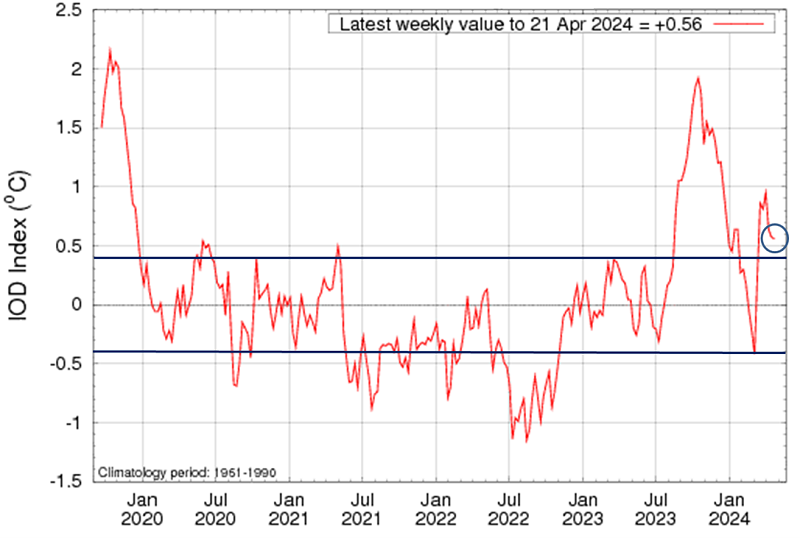
The Equatorial Pacific Ocean surface cooled to below El Niño threshold in April. The oceanic values for NINO3 and NINO3.4 are +0.45oC and +0.79oC respectively (22 April). Cool water has just started to outbreak to the surface off Ecuadorian coast. The Coral Sea moisture zone to the northeast is warmer and remains switched on. The Indian Ocean remains at a quasi positive IOD value of +0.56 oC mainly on the back of warmer water off Africa. Once the wet season finishes in coming weeks, it’s going to be interesting to see how this ocean pattern pans out.
Sea surface temperatures are the key to the world’s rainfall. For more information on how they are measured, maps created and how to read them, check out our eLearn
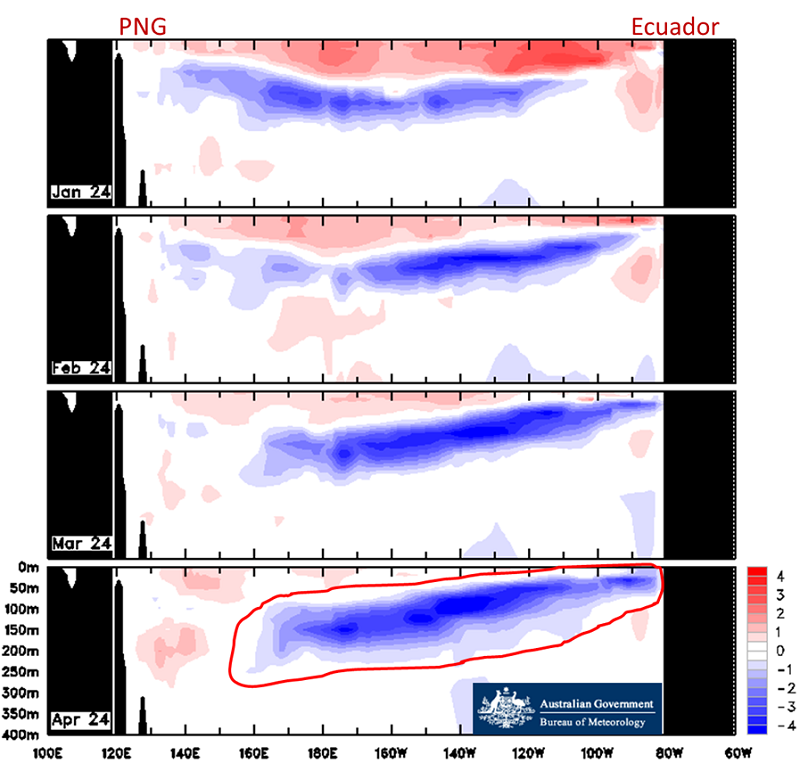
Equatorial Pacific sub-sea temperature anomalies
Analysis done 18 April 2024
The Pacific Ocean Equatorial sub-surface temperature cooled at the surface over April and no heat remains. The cool water off the Ecuadorian coast has started to upwell at the surface. This large slug of cool water to depth is the main indicator that models are using to predict a La Niña.
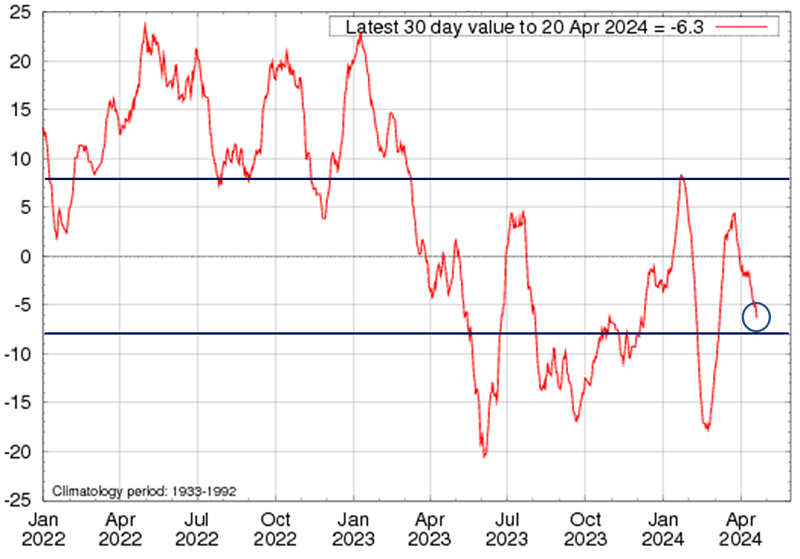
Southern Oscillation Index (SOI)
30-day moving SOI
The SOI remains at neutral values in April, currently at -6.3 (as of 22 April 2024). Negativity is coming from the fact that the pressure is higher at Darwin than at Tahiti. If pressure started to lower to our tropical north and the SOI rose above +7 that could be indicative of a switch to La Niña like pressure behaviour. One the northern wet season is over the underlying pressure pattern should become more apparent.
.
© Copyright Commonwealth of Australia 2024. Bureau of Meteorology
Dipole Mode Index (DMI)
The DMI is the difference between the temperature of the west and east boxes of ocean monitored for the IOD. The DMI is at a +IOD like value of +0.56oC, above the threshold of +0.4oC. This is mainly being driven by warmer water off Africa rather than an ’eye’ of cool water off Sumatra. The Sumatran region is going to warrant close watching in coming months.
© Copyright Commonwealth of Australia 2024. Bureau of Meteorology.
Pacific Ocean surface wind anomalies
Wind direction and strength anomalies for the last 30 days
Surface winds (m/s) 30-day anomaly for: Thursday 21 March 2024 to Friday 19 April 2024.
Equatorial trade winds in the Pacific Ocean are normal. Stronger easterly trade winds would indicate a possible impetus for La Niña formation. A major change this month has been sustained stronger than normal easterly winds off Indonesia. This is needed to potentially kick of a proper +IOD, as easterly wind would be expected to cool off the Sumatran coastline and warm up the African zone.
.
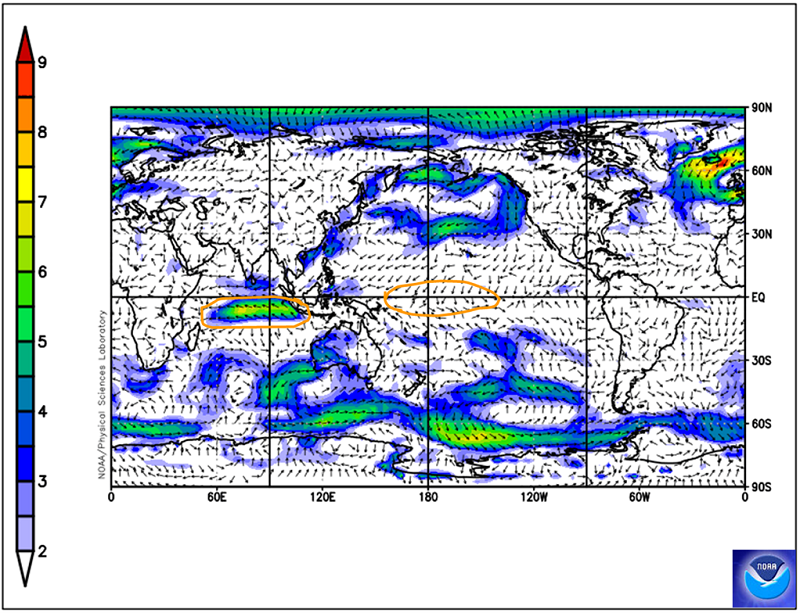
(NCEP Operational climatology data: 1985 -1996, smoothed with five-day running mean) Source: NOAA
World cloudiness anomalies
OLR Anomalies: Average of 15 March 2024 to 14 April 2024
Cloud patterns around the international dateline junction and the broader equatorial Pacific are close to normal. A La Niña pattern would show much less cloud at the dateline. Extra cloud exists over northern Australia in keeping with the much warmer water in the coral sea. A large area of less cloud in the eastern Indian Ocean and greater cloud off east Africa is in a +IOD like pattern. This could be due to tropical weather patterns like the MJO but is also loosely based on the underlying difference in temperature between Africa and Indonesia. When the wet season stops it will be interesting to see if this pattern remains or falls apart.
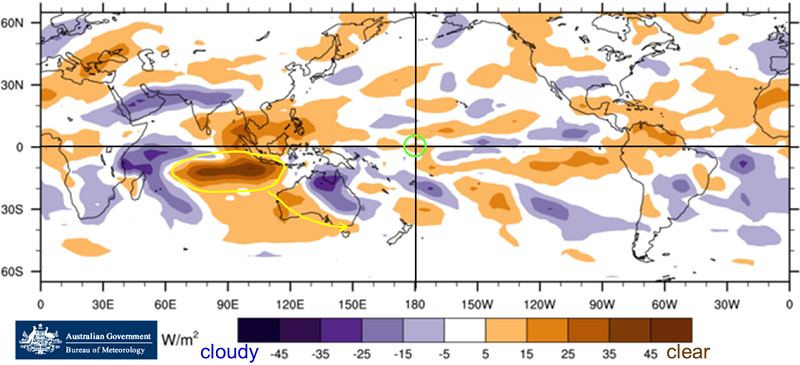
Source: Bureau of Meterology
Southern Annular Mode (SAM)
AAO: Observed and GFS forecasts
Observations 18 December 2023 to 15 April 2024
The Southern Annular Mode (SAM) or Antarctic Oscillation (AAO) is currently neutral. In the first half of April the SAM was weak to moderately positive. In autumn, SAM is a much more unreliable climate driver. A positive SAM in the first week of the month potentially helped the rainfall in parts of the state by pulling the tropics closer. The Bureau of Meteorology models the SAM into weak negativity and NOAA keeps it at neutral over the next 2 weeks.
Source: NOAA
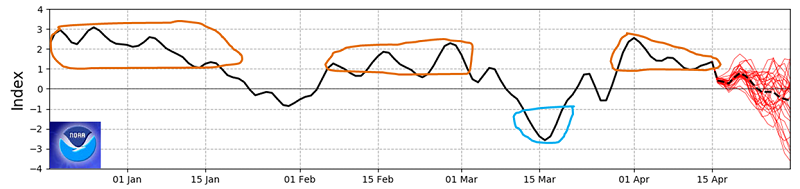
Madden Julian Oscillation (MJO)
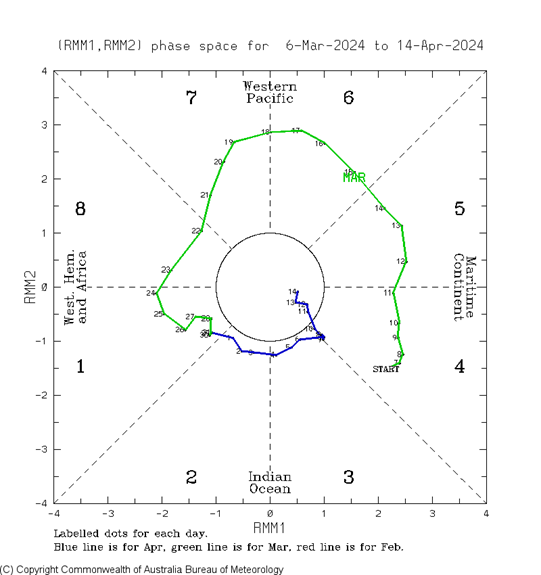
MJO Phase Diagram for 6 March 2024 to 14 April 2024
In the last 15 days the Madden Julian Oscillation (MJO) has been barely in existence inside the circle weak values, starting and ending in the middle of the Indian Ocean. This included a moderately strong burst into the important moisture zone positions of five and six across northern Australia. Victoria didn’t get any triggers passing through at that time to get a connection into that moisture source. The BoM ACCESS model predicts the MJO to remain undefined for the next 30 days. It’s possible the strong cloud differential set up in the Indian Ocean is preventing its propagation further eastwards. It normally takes around 40 days to travel round the equator and be back in a similar position.
Air pressure
Last 30 days air pressure
Sea level pressure (mb) 30-day mean for: Thursday 21 March 2024 to Friday 19 April 2024.
In the past 30 days the Sub Tropical Ridge of High Pressure (STR) shifted slightly north, but the pressure centre has remained a bit south of a normal autumn position over Adelaide. The large pressure to our west moved closer to Victoria and this was a cold front blocking pattern for western Victoria. Until the pressure ridge moves up to allow fronts across the state, drier conditions are more likely.
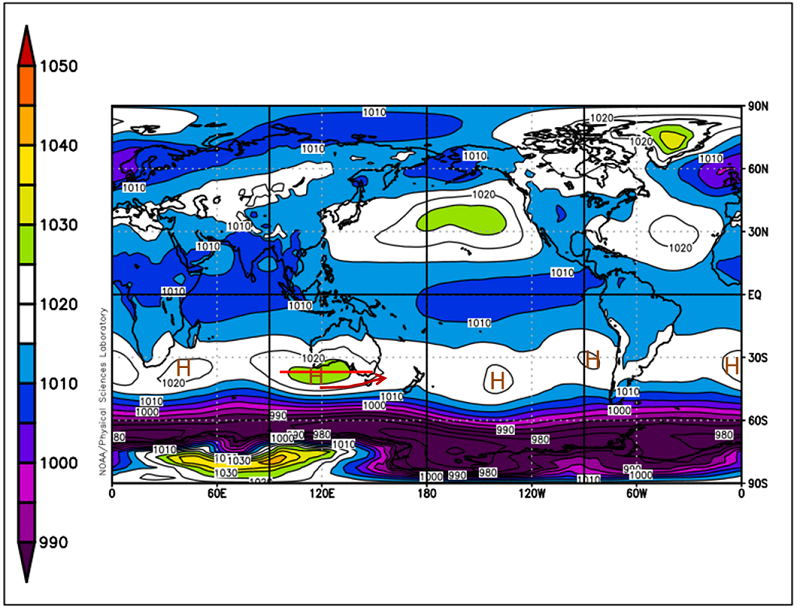
Source: NOAA
Air pressure anomalies
Last 30 days air pressure anomaly
Sea level pressure (mb) 30-day anomaly for: Thursday 21 March 2024 to Friday 19 April 2024.
The Sub Tropical Ridge was higher in pressure over Victoria with the anomaly moving closer to the state. The higher than normal pressure has meant the pressure systems are moving slower, leading to longer periods of stable weather. Pressure is normal at Tahiti and slightly higher at Darwin which is why the SOI is weakly negative. Pressure is lower over east Africa commensurate with warmer water and greater cloud.
(NCEP Operational climatology data: 1985 – 1996, smoothed with five-day running mean). Source: NOAA
Climate definitions
Read a list of climate acronyms and explanations.
Modelled climate and ocean predictions for Victoria from April 2024 run models
Twelve climate models show their predictions for the next six months for the Pacific Ocean, Indian Ocean, rainfall and temperature for Victoria.
Our new e-learn explains this table.
* Abbreviations:
CGCM | CGCM | CGCM | CGCM | CGCM | CGCM | CGCM | CGCM | Ensemble | Ensemble | Ensemble | Statistical | ||||||
|---|---|---|---|---|---|---|---|---|---|---|---|---|---|---|---|---|---|
Phenomena | System 5 ECMWF Europe | ACCESS-S BoM Australia | SINTEX-F JAMSTEC Japan | CFSv2 NCEP USA | GEOS-S2S NASA USA | EPS JMA Japan | CSM1.1m BCC China | GloSea5 UKMO UK | NMME USA | C3S Europe | MME APCC Korea | SOI phase USQ/Qld Australia | |||||
Month of Run | Apr | Apr | Apr | Apr | Apr | Apr | Apr | Apr | Mar | Mar | Mar | Mar | |||||
Forecast months* | MJJ | MJJ | MJJ | MJJ | MJJ | MJJ | MJJ | MJJ | AMJ | AMJ | AMJ | AMJ | |||||
Rainfall Skill AMJ | Low | Moderate | - | Low | Moderate | Moderate | - | Moderate | Moderate | - | - | - | |||||
Winter Pacific Ocean NINO3.4 | Normal | Slightly warm | Normal | Normal | Cool (weak La Niña) | Cool (weak La Niña) | Slightly warm | Cool (La Niña) | Cool (weak La Niña) | Slightly Cool | Slightly Cool | SOI rising | |||||
Winter Eastern Indian Ocean | Cool (+IOD) | Cool (+IOD) | Cool (+IOD) | Slightly warm | Slightly warm | Cool (+IOD) | Slightly warm | Cool (+IOD) | Slightly warm | Slightly warm | Slightly warm | - | |||||
Winter Rainfall | Neutral, slightly drier SW Coast | Neutral | Neutral | Neutral, slightly drier SW | Neutral | Slightly drier | Neutral | Slightly drier | Neutral, slightly drier SW Coast, slightly wetter far E | Neutral, slightly drier SW | Neutral | Neutral | |||||
Winter Temperature | Warmer | Warmer | Slightly warmer | Slightly warmer E, neutral W | Slightly warmer | Neutral, slightly warmer far W | Warmer | Warmer | Slightly warmer | Warmer | Warmer | - | |||||
Forecast months* | ASO | JAS | ASO | ASO | ASO | - | ASO | JAS | JAS | JAS | JAS | - | |||||
Spring Pacific Ocean NINO3.4 | Slightly Cool | Normal | Cool (weak La Niña) | Cool (La Niña) | Cool (La Niña) | - | Slightly warm | Cool (La Niña) | Cool (La Niña) | Cool (La Niña) | Cool (La Niña) | - | |||||
Spring Eastern Indian Ocean | Cool (+IOD) | Cool (+IOD) | Cool (+IOD) | Warm | Cool (+IOD) | - | Normal | Cool (+IOD) | Slightly warm | Slightly warm | Slightly warm | - | |||||
Spring Rainfall | Neutral | - | Neutral | Neutral, slightly wetter far N | Neutral | - | Neutral N, slightly drier S | Neutral | Slightly wetter S, wetter N | Slightly wetter N, neutral S | Neutral, slightly drier far SW | - | |||||
Spring Temperature | Warmer | - | Slightly warmer | Slightly warmer | Slightly warmer | - | Slightly warmer | Warmer | Warmer E, slightly warmer W | Warmer | Slightly warmer N warmer S | - | |||||
Further Info | Operational | Operational | Experimental | Operational | Experimental | Experimental | Operational | Operational | Experimental Summary of 8 dynamic models | Experimental Summary of 9 dynamic models | Experimental Summary of 13 dynamic models | 5 phase system based on previous 2 months SOI | |||||
*MJJ = May, June, July *JAS = July, August, September *ASO = August, September, October
Phenomena | System 5 ECMWF Europe | ACCESS-S BoM Australia | SINTEX-F JAMSTEC Japan | CFSv2 NCEP USA |
|---|---|---|---|---|
Month of Run | Apr | Apr | Apr | Apr |
Forecast months* | MJJ | MJJ | MJJ | MJJ |
Rainfall Skill MJJ | Low | Moderate | - | Low |
Winter Pacific Ocean NINO3.4 | Normal | Slightly warm | Normal | Normal |
Winter Eastern Indian Ocean | Cool (+IOD) | Cool (+IOD) | Cool (+IOD) | Slightly warm |
Winter Rainfall | Neutral, slightly drier SW Coast | Neutral | Neutral | Neutral, slightly drier SW |
Winter Temperature | Warmer | Warmer | Slightly warmer | Slightly warmer E, Neutral W |
Forecast months* | ASO | JAS | ASO | ASO |
Spring Pacific Ocean NINO3.4 | Slightly Cool | Normal | Cool (weak La Niña) | Cool (La Niña) |
Spring Eastern Indian Ocean | Cool (+IOD) | Cool (+IOD) | Cool (+IOD) | Warm |
Spring Rainfall | Neutral | - | Neutral | Neutral, slightly wetter far N |
| Spring Temperature | Warmer | - | Slightly warmer | Slightly warmer |
Further Info | Operational | Operational | Experimental | Operational |
*MJJ = May, June, July *JAS = July, August, September *ASO = August, September, October
Phenomena | GEOS-S2S NASA USA | EPS JMA Japan | CSM1.1m BCC China | GloSea5 UKMO UK |
|---|---|---|---|---|
Month of Run | Apr | Apr | Apr | Apr |
Forecast months* | MJJ | MJJ | MJJ | MJJ |
Rainfall Skill MJJ | Moderate | Moderate | - | Moderate |
Winter Pacific Ocean NINO3.4 | Cool (weak La Niña) | Cool (weak La Niña) | Slightly warm | Cool (La Niña) |
Winter Eastern Indian Ocean | Slightly warm | Cool (+IOD) | Slightly warm | Cool (+IOD) |
Winter Rainfall | Neutral | Slightly drier | Neutral | Slightly drier |
Winter Temperature | Slightly warmer | Neutral, slightly warmer far W | Warmer | Warmer |
Forecast months* | ASO | - | ASO | JAS |
Spring Pacific Ocean NINO3.4 | Cool (La Niña) | Cool (weak La Niña) | Normal | Cool (La Niña) |
Spring Eastern Indian Ocean | Cool (+IOD) | - | Normal | Cool (+IOD) |
Spring Rainfall | Neutral | - | Neutral N, slightly drier S | Neutral |
Spring Temperature | Slightly warmer | - | Slightly warmer | Warmer |
Further Info | Experimental | Experimental | Operational | Operational |
*AMJ =April, May, June *JJA =June, July, August *JAS = July, August, September
Phenomena | NMME USA | C3S Europe | MME APCC Korea | SOI phase USQ/Qld Australia |
|---|---|---|---|---|
Month of Run | Apr | Apr | Apr | Apr |
Forecast months* | MJJ | MJJ | MJJ | MJJ |
Rainfall Skill MJJ | Moderate N / Low S | - | - | - |
Winter Pacific Ocean NINO3.4 | Slightly Cool | Slightly Cool | Slightly Cool | SOI neutral |
Winter Eastern Indian Ocean | Slightly cool (weak +IOD) | Slightly cool (weak +IOD) | Slightly cool (weak +IOD) | - |
Winter Rainfall | Neutral, slightly drier SW, slightly wetter far E | Neutral, slightly drier SW | Slightly drier S, Neutral N | Neutral |
Winter Temperature | Warmer | Warmer | Warmer | - |
Forecast months* | ASO | JAS | ASO | - |
Spring Pacific Ocean NINO3.4 | Cool (La Niña) | Cool (La Niña) | Cool (La Niña) | - |
Spring Eastern Indian Ocean | Slightly warm | Cool (+IOD) | Cool (+IOD) | - |
Spring Rainfall | Slightly wetter, neutral WSW | Neutral | Slightly wetter N, neutral S | - |
Spring Temperature | Slightly warmer | Warmer | Slightly warmer N, warmer S | - |
Further Info | Experimental Summary of 8 dynamic models | Experimental Summary of 7 dynamic models | Experimental Summary of 13 dynamic models | 5 phase system based on previous 2 months SOI |
*AMJ =April, May, June *JJA =June, July, August *JAS = July, August, September
Image references
Original images used in this document are sourced from the Bureau of Meteorology under a Creative Commons 3.0 licence and from the NOAA who have a Public Domain policy. Annotations highlighting areas of interest have been added by Dale Grey.