The Fast Break – Victoria
In summary
- Pressure has strengthened into a blocking pattern over Victoria, which is more classic El Niño behaviour.
- The Pacific Ocean is acting in a fully coupled ocean/atmosphere El Niño.
- The Indian Ocean has made some progress towards a positive IOD.
Conditions throughout July have been generally drier across the western half of the state and much lower in central and east Gippsland. Rainfall in the eastern Mallee, northern country, west Gippsland and north-east Victoria was more than normal.
Soil moisture probes were unchanged in most areas but remain less than 50 percentage points full in central and east Gippsland. Most high-rainfall areas are now at 100% capacity and running off when rainfall is in excess. Temperatures from April through to the end of June were much warmer than normal and crop growth was 2 weeks ahead of normal. Some frosts started to occur in the north in July, as temperatures returned to more normal values.
The Pacific Ocean cemented its strong El Niño status with further increases of ocean surface temperature and has surpassed 2 °C above average. Pressure, wind, temperatures to depth and cloud patterns all appear to be behaving as a classic El Niño. Some small cooler patches in sea surface temperatures to our north have started to appear. The moisture source to our north is being suppressed.
The Indian Ocean had been behaving itself but in the last week a stronger burst of easterly wind occurred off Java in Indonesia. This has upwelled cooler than normal water in the eastern half of the east Indian Ocean Dipole (IOD) box such that the Dipole Mode Index (DMI) value is +IOD-like. Water is very warm off Africa, which is also driving this value. Atmospherically, nothing yet has happened off Africa, but pressure and cloud are reminiscent of +IOD in the east. While the burst of easterly wind has now stopped, further easterly winds would be needed to get this event properly going into +IOD territory.
The Southern Annular Mode (SAM) is currently negative, which would normally mean storms and fronts being pushed closer to Victoria, but higher pressure is winning this race. Paradoxically, a negative SAM is more common in El Niño years.
The Madden–Julian Oscillation has been in an unfavourable position, with the cloud wave sitting closer to the central Pacific Ocean. This pattern often leads to less cloud in the tropical Indian Ocean. The MJO is predicted to make a strong run north of Australia in the first week of August. We will see whether that occurs and we can get a connection into it.
Pressure has been the biggest mover this month, as stronger than normal pressure systems spent more time over southern Australia, blocking some rain-bearing systems. This was a major change from the previous 3 months of favourable pressure patterns and is a classic El Niño characteristic that can lead to reduced rainfall. A majority of models with drier outcomes have this increased pressure pattern continuing.
My assessment of 12 climate models for Victoria is for likely drier and likely warmer for the next 3 months.
Soil moisture
Plant-available moisture decile 29 July 2026
The BoM Australian Water Outlook (AWO) plant-available soil moisture deciles for perennial pasture shows south-west, Wimmera, north-east and west Gippsland areas close to normal. The Mallee and northern country are wetter at decile 8 to 9. Central Gippsland is drier at decile 2 to 3 and far east Gippsland is much drier at decile 1. Soil moisture was unchanged for the month in most locations. The 10 sites that decreased fell by a median of 3 percentage points and the 5 sites that rose increased by 26 percentage points. Run-off is occurring in many locations with a 100% profile.
In the last 30 days, the Omeo pasture site increased by 21 percentage points from 25 to 46%. The Willaura crop site increased by 14 percentage points from 55 to 69%.
Soil moisture probe data can be accessed in real time at Agriculture Victoria’s soil moisture monitoring website.
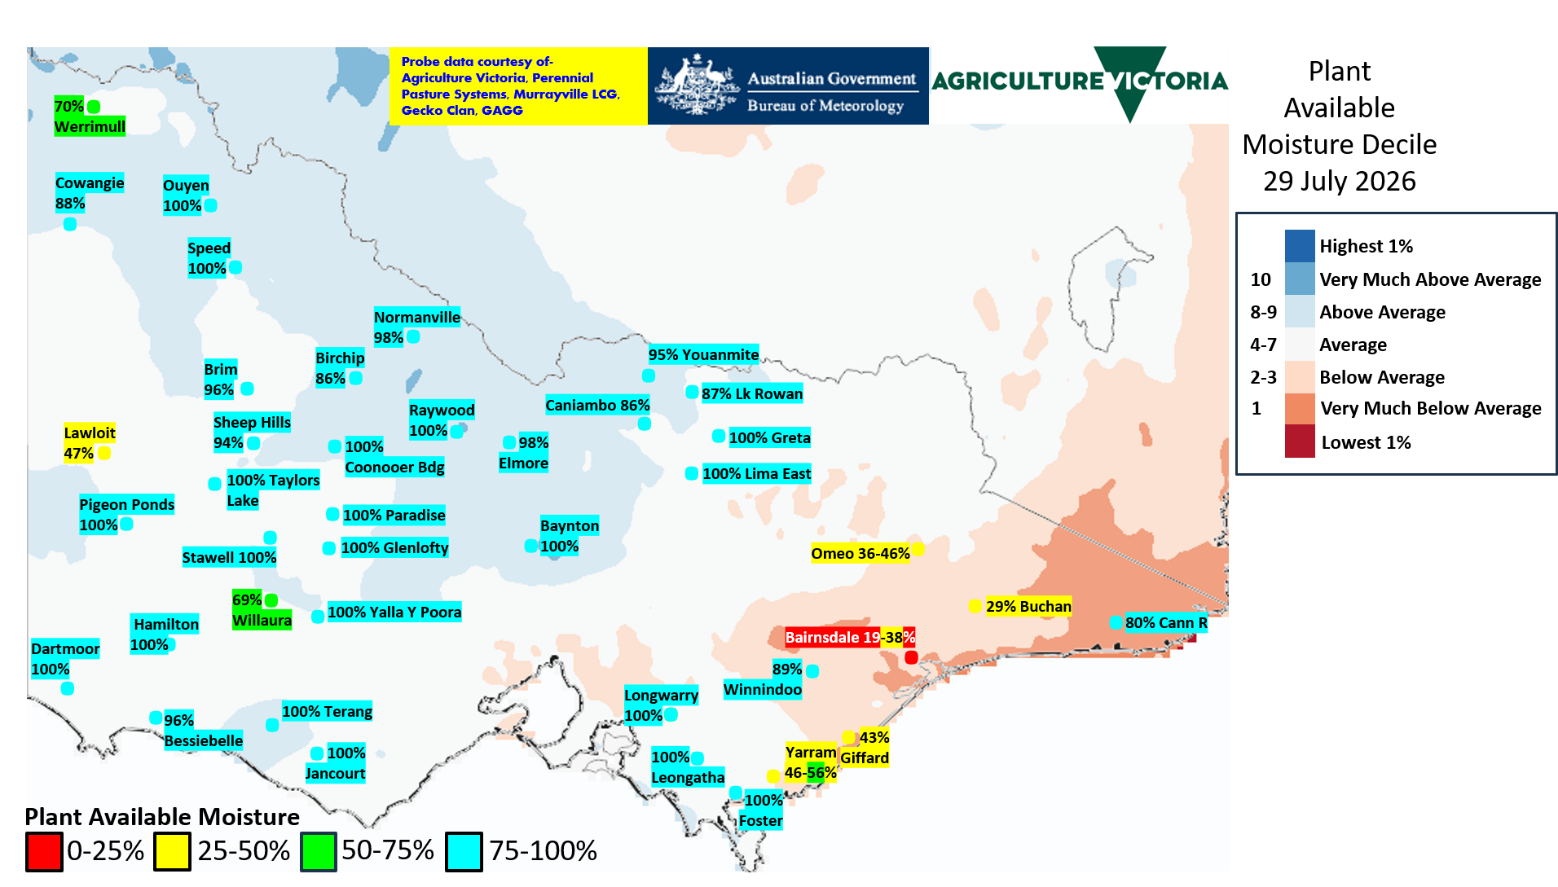
Probes from Agriculture Victoria, Gecko Clan, Perennial Pasture Systems, Gippsland Agriculture Group and Murrayville Landcare networks.
| Bairnsdale perennial | 19 |
Buchan perennial | 29 |
Omeo perennial | 36 |
Bairnsdale perennial | 38 |
Giffard fodder | 43 |
Yarram perennial rye | 46 |
Omeo multi species | 46 |
Lawloit lucerne | 47 |
Yarram prairie grass | 56 |
Willaura | 69 |
Werrimull crop | 70 |
Cann River perennial | 80 |
Birchip crop | 86 |
Caniambo crop | 86 |
Lake Rowan lucerne | 87 |
Cowangie crop | 88 |
Winnindoo | 89 |
Sheep Hills crop | 94 |
Youanmite crop | 95 |
Brim crop | 96 |
Bessiebelle perennial | 96 |
Elmore crop | 98 |
Normanville crop | 98 |
Coonooer Bridge crop | 100 |
Ouyen crop | 100 |
Raywood crop | 100 |
Speed crop | 100 |
Taylors Lake crop | 100 |
Baynton basalt phalaris | 100 |
Baynton granite annual | 100 |
Baynton granite phalaris | 100 |
Dartmoor lucerne | 100 |
Glenlofty perennial | 100 |
Greta annual pasture | 100 |
Greta summer pasture | 100 |
Greta hill annual | 100 |
Jancourt perennial rye | 100 |
Paradise perennial | 100 |
Lima East perennial | 100 |
Terang perennial | 100 |
Longwarry perennial rye | 100 |
Longwarry chicory | 100 |
Hamilton crop | 100 |
Pigeon Ponds rye and balansa | 100 |
Yalla-Y-Poora crop | 100 |
Leongatha perennial | 100 |
Foster | 100 |
Stawell perennial | 100 |
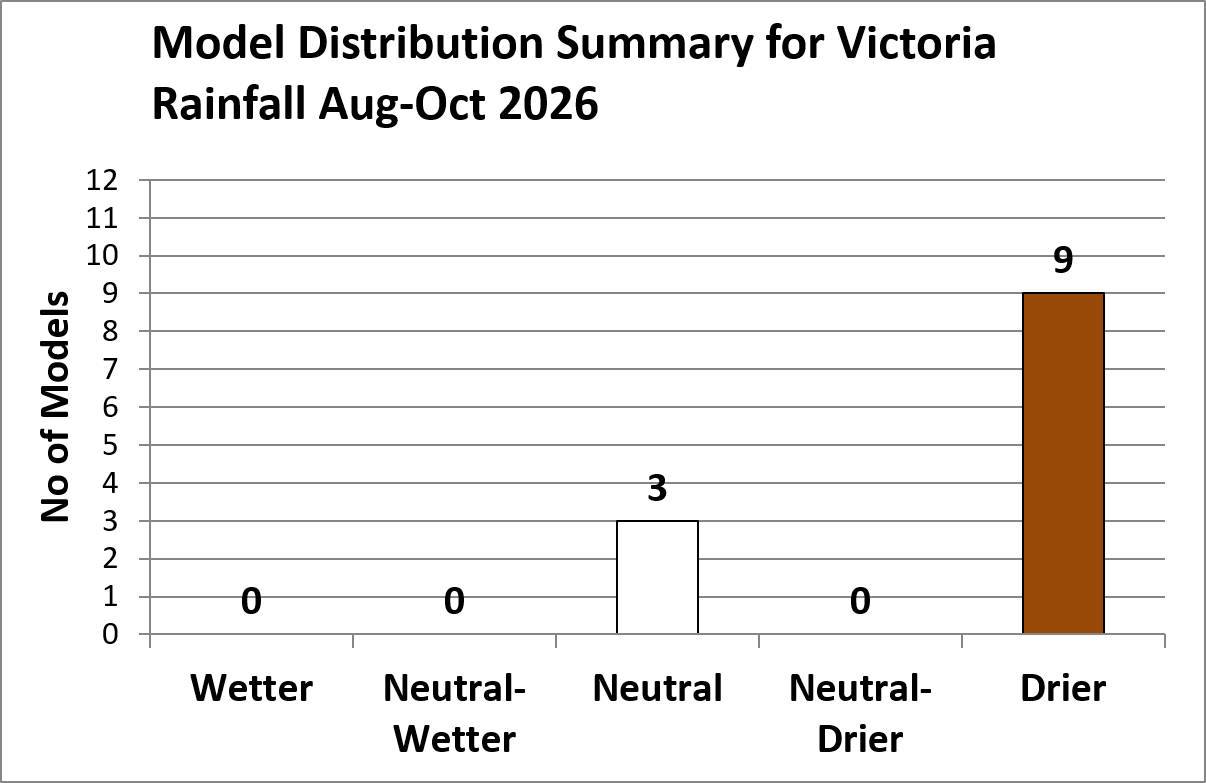
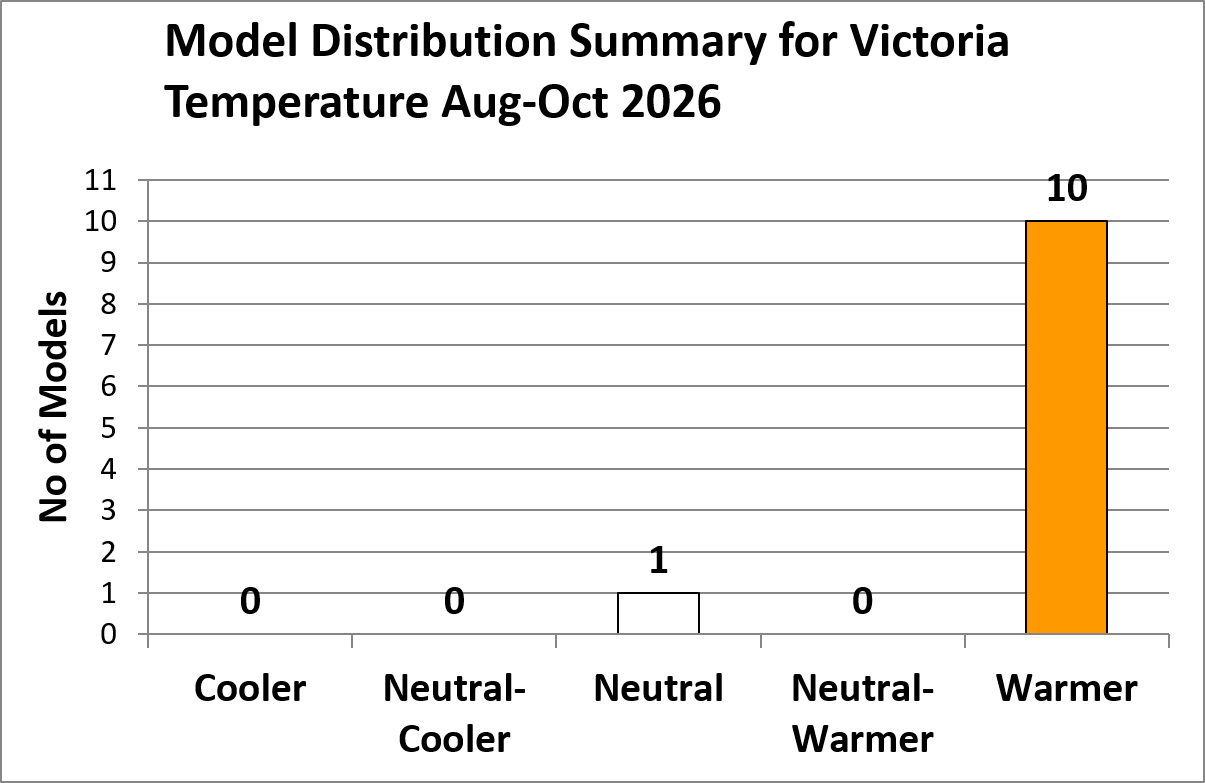
Model distribution summary for the next 3 months
Predictions for August to October 2026 Victorian rainfall – the outlook from 12 global model forecasts is likely drier.
Predictions for August to October 2026 Victoria temperature – the outlook from 11 global model forecasts is for likely warmer.
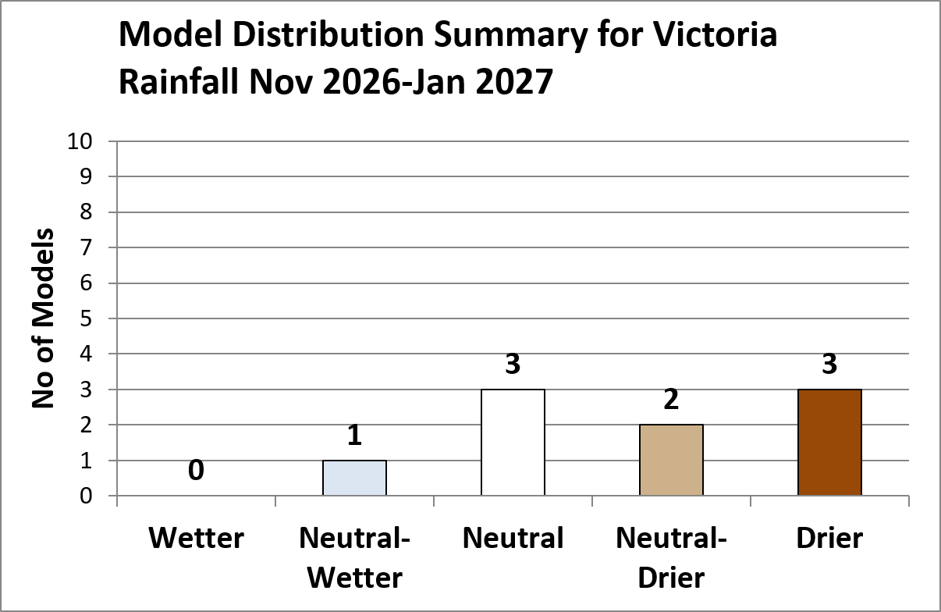
Model distribution summary for the next 4 to 6 months
Predictions for November 2026 to January 2027 Victorian rainfall – the outlook from 9 global model forecasts is split between neutral and drier but there are also sniffs of wetter in some models.
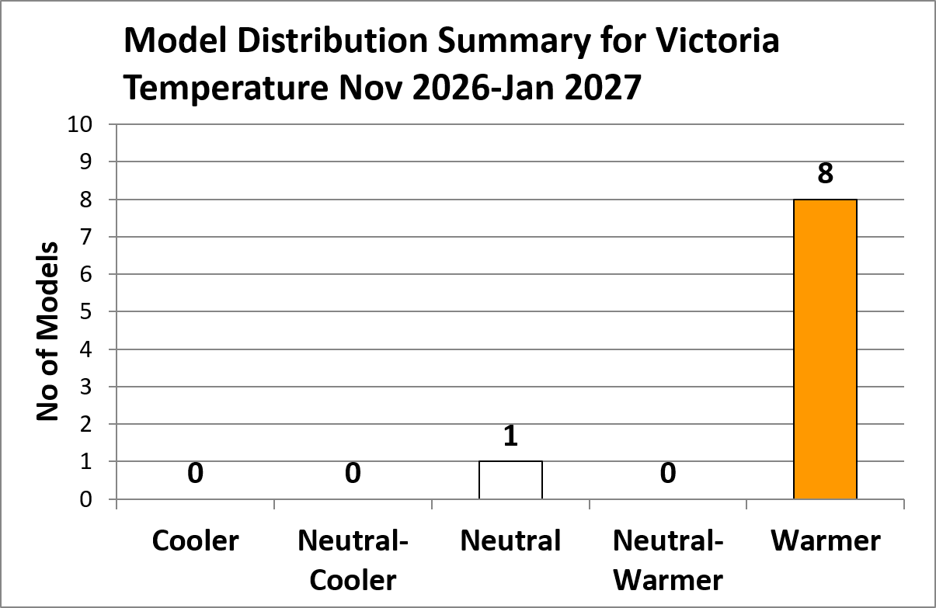
Predictions for November 2026 to January 2027 Victorian temperature – the outlook from 9 global model forecasts is for likely warmer.
Model consensus forecast for the next 6 months
Current outlook (29 July 2026)
| Phenomenon | August–October 2026 | November 2026 – January 2027 |
|---|---|---|
| Pacific Ocean | Warm (El Niño) | Warm (El Niño) |
| Indian Ocean | Cooler (+IOD) | Cooler (+IOD)/warmer |
| Rainfall | Drier | Neutral/drier |
| Temperature | Warmer | Warmer |
Previous outlook (26 June 2026)
| Phenomenon | July–September 2026 | October–December 2026 |
|---|---|---|
| Pacific Ocean | Warm (El Niño) | Warm (El Niño) |
| Indian Ocean | Cooler (+IOD) | Cooler (+IOD) |
| Rainfall | Drier | Drier |
| Temperature | Warmer | Warmer |
Sea surface temperature (SST) anomalies
During July the eastern equatorial Pacific Ocean surface rapidly warmed further and is now over the 2 °C ‘super’ status threshold for El Niño. The relative oceanic values for NINO3 and NINO3.4 were +2.39 °C and +1.94 °C, respectively (26 July).
Seas to the north of Australia have been slowly cooling to normal levels. A few patches of cooler than normal water are appearing. Cooler oceans to our north evaporate less moisture into the atmosphere as a rain source.
The Indian Ocean is very warm in the western basin and is starting to cool in the eastern half of the eastern box that is monitored for the IOD. The Dipole Mode Index value is currently at +0.44 °C (26 July), which is a +IOD-like value. It is not uncommon for +IODs to form in conjunction with El Niños.
Sea surface temperatures are the key to the world’s rainfall. For more information on how they are measured, maps created and how to read them, check out our eLearn.
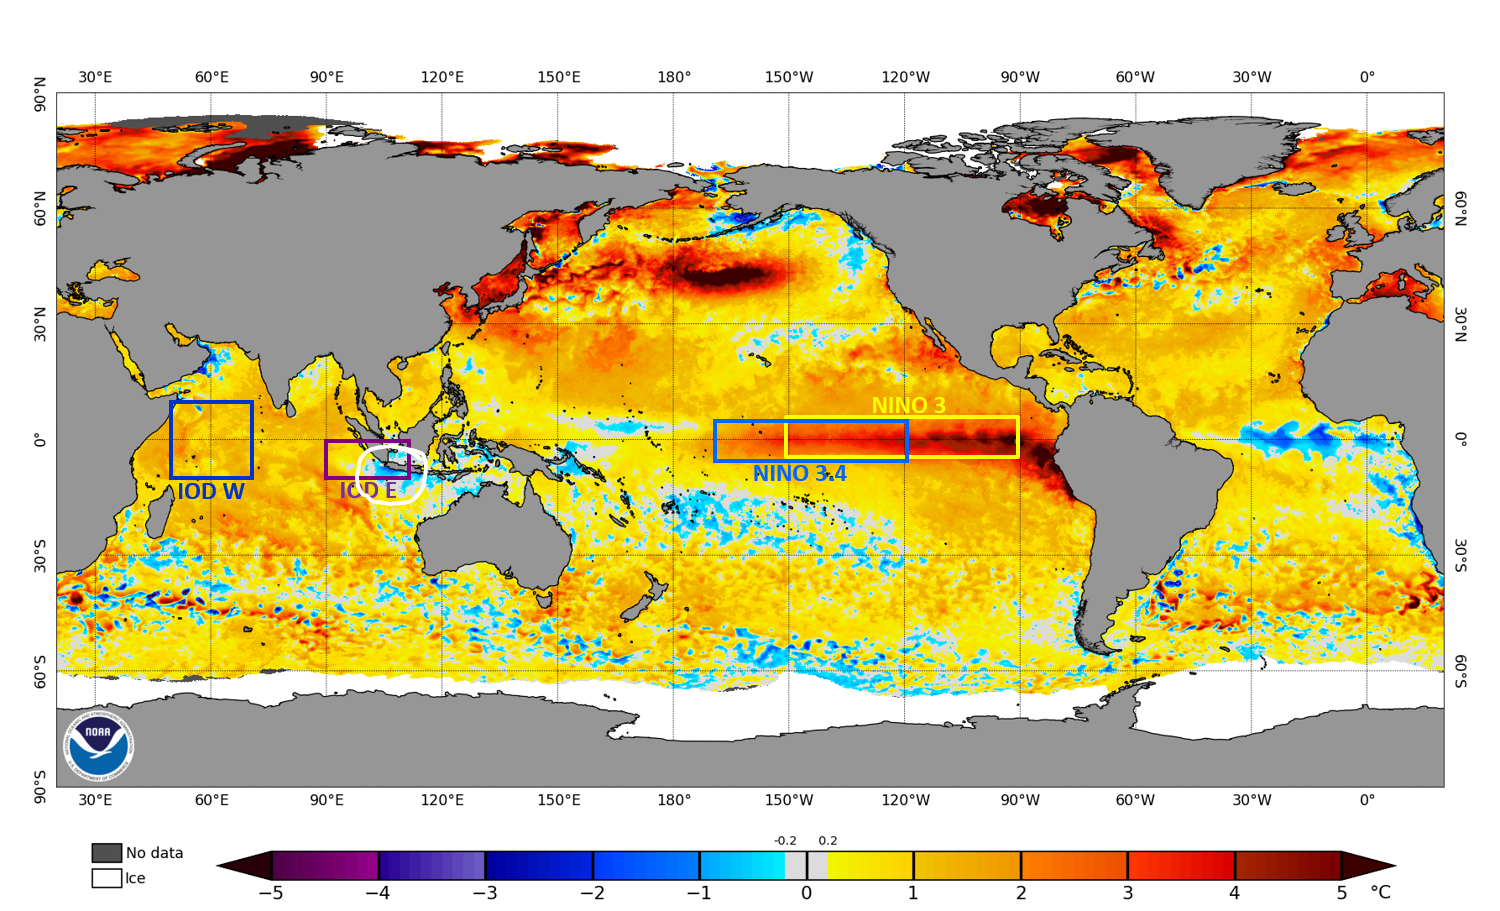
National Oceanic and Atmospheric Administration (NOAA) Coral Reef Watch Daily 5 km SST Anomalies (Version 3.1) 27 July 2026.
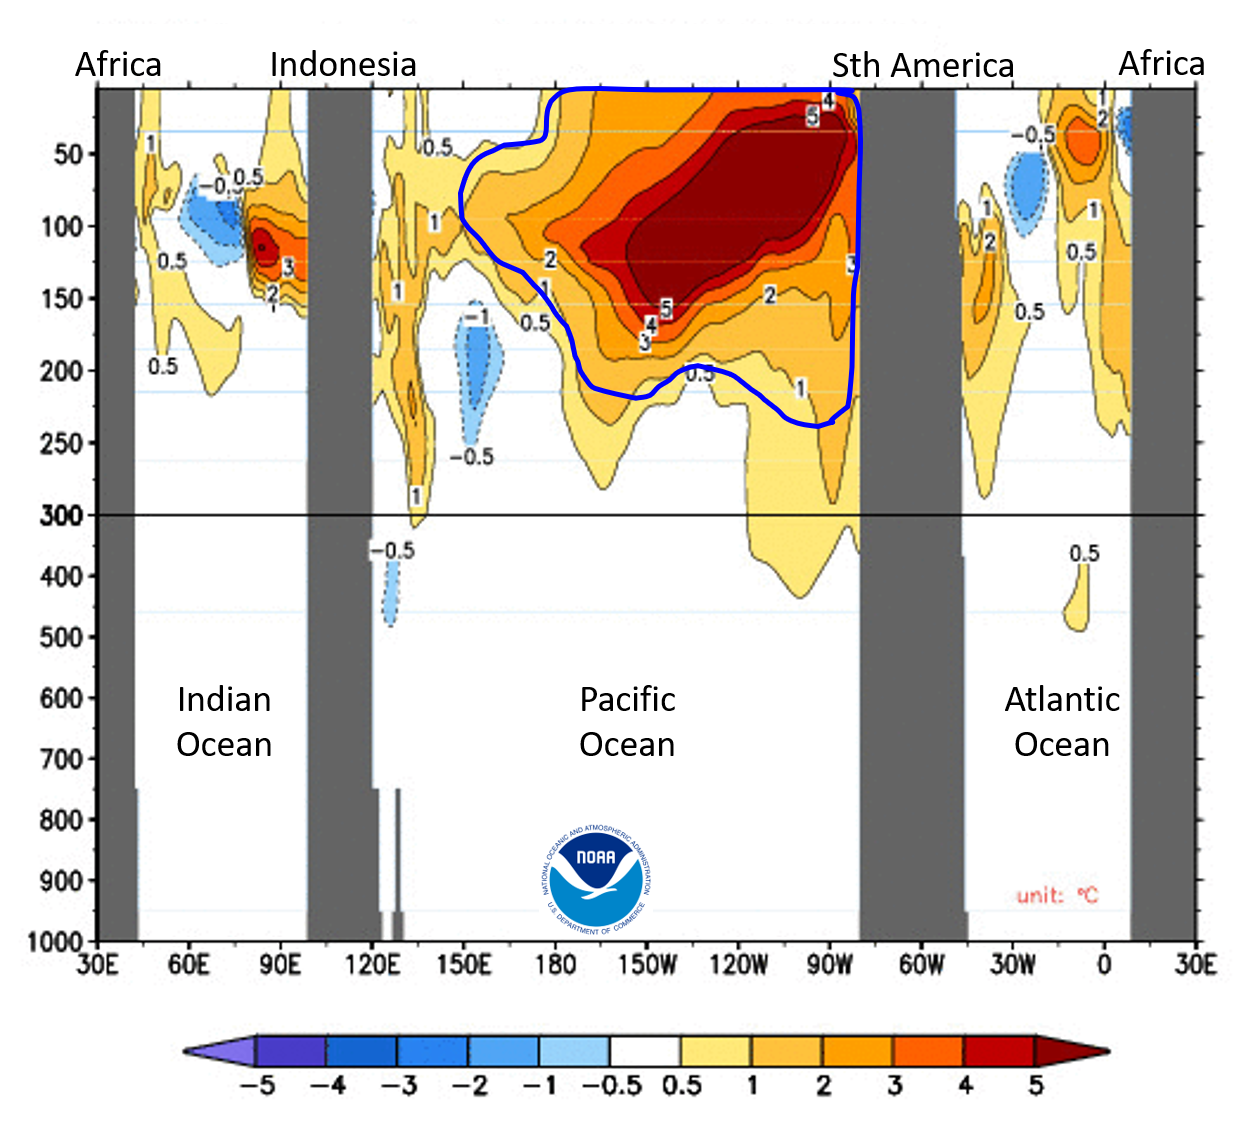
Equatorial last 30-day subsea temperature anomalies
Average of 27 June to 22 July 2026
The Pacific Ocean equatorial subsurface temperatures show a large volume of warmer than normal water. This is preheating the surface waters in the eastern Pacific where it upwells. This massive amount of heat has taken many months to build up and will take many to dissipate.
The eastern Indian Ocean shows no pre-IOD-like patterns.
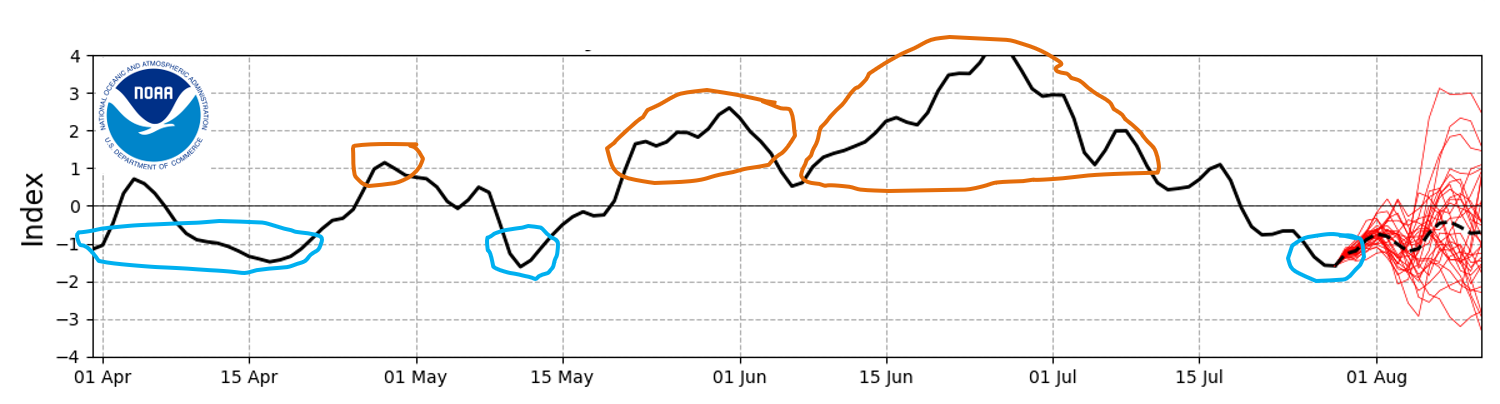
Southern Oscillation Index (SOI)
30-day moving SOI 26 July 2026
The SOI is the difference in air pressure between Tahiti and Darwin.
During July the SOI has remained at a strongly negative value below the −7 value for El Niño, currently at −28 (as of 26 July). This has been due to very low pressure at Tahiti and higher pressure at Darwin. Higher pressure to our tropical north makes it harder to bring tropical moisture down to Victoria.
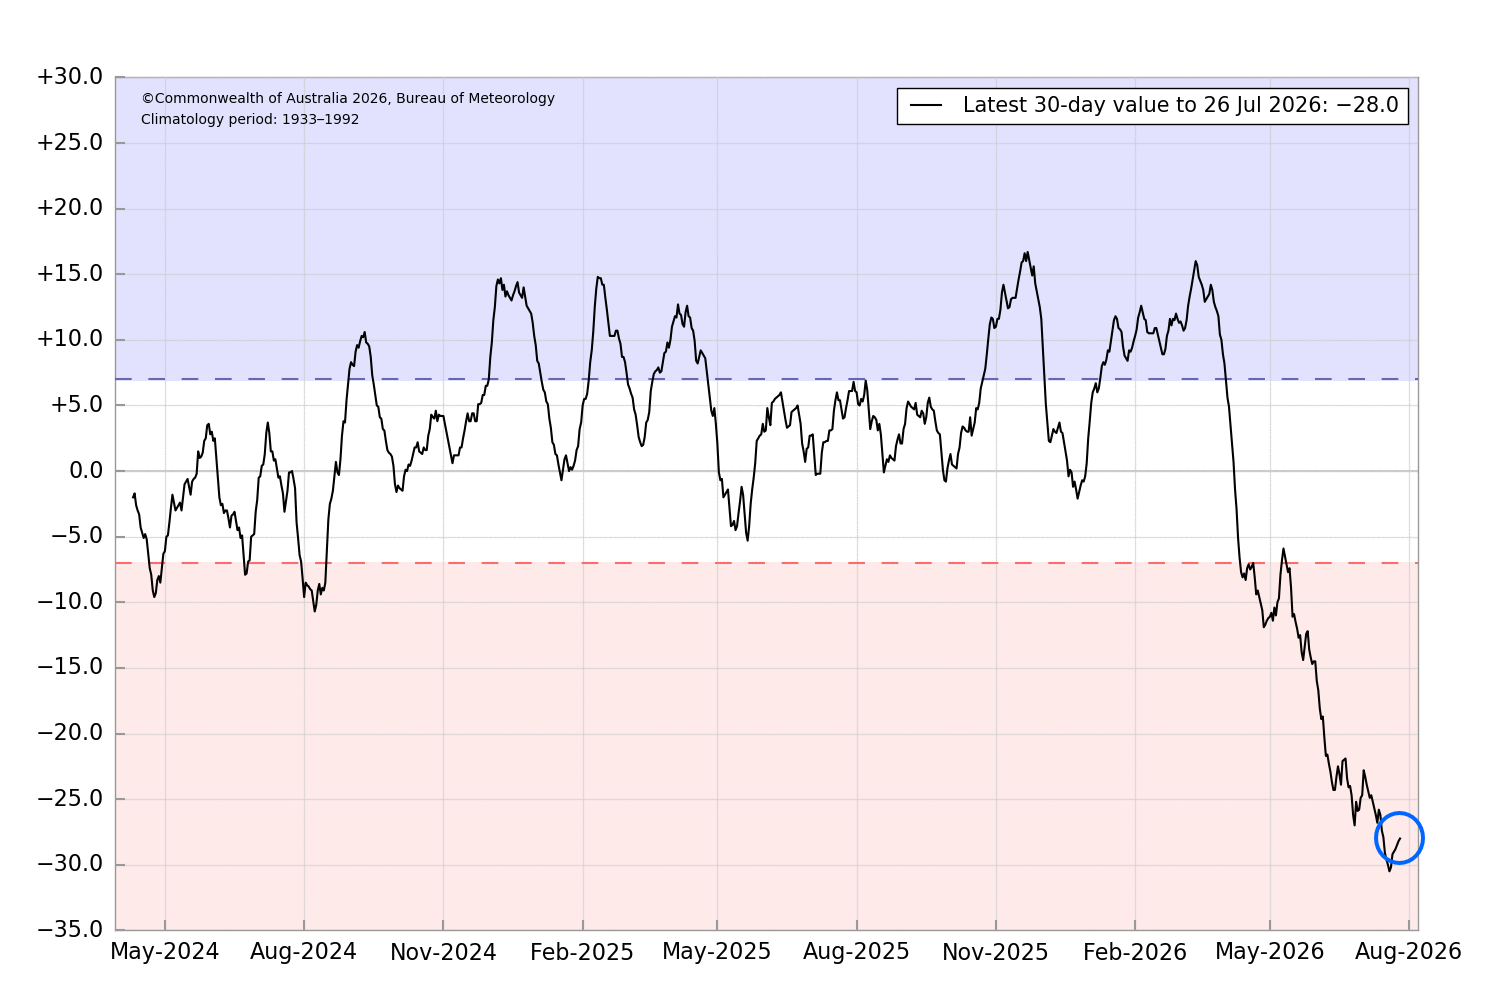
© Copyright Commonwealth of Australia 2026. Bureau of Meteorology. Climatology period 1933-1992.
Dipole Mode Index (DMI)
Latest weekly value to 26 July 2026
The DMI is the difference between the temperature of the west and east boxes of the Indian Ocean monitored for the IOD.
The DMI has just reached a positive IOD-like value over the threshold of +0.40 °C. This is on the back of much warmer than normal water off east Africa and a cooler pattern emerging off the island of Java in the eastern box.
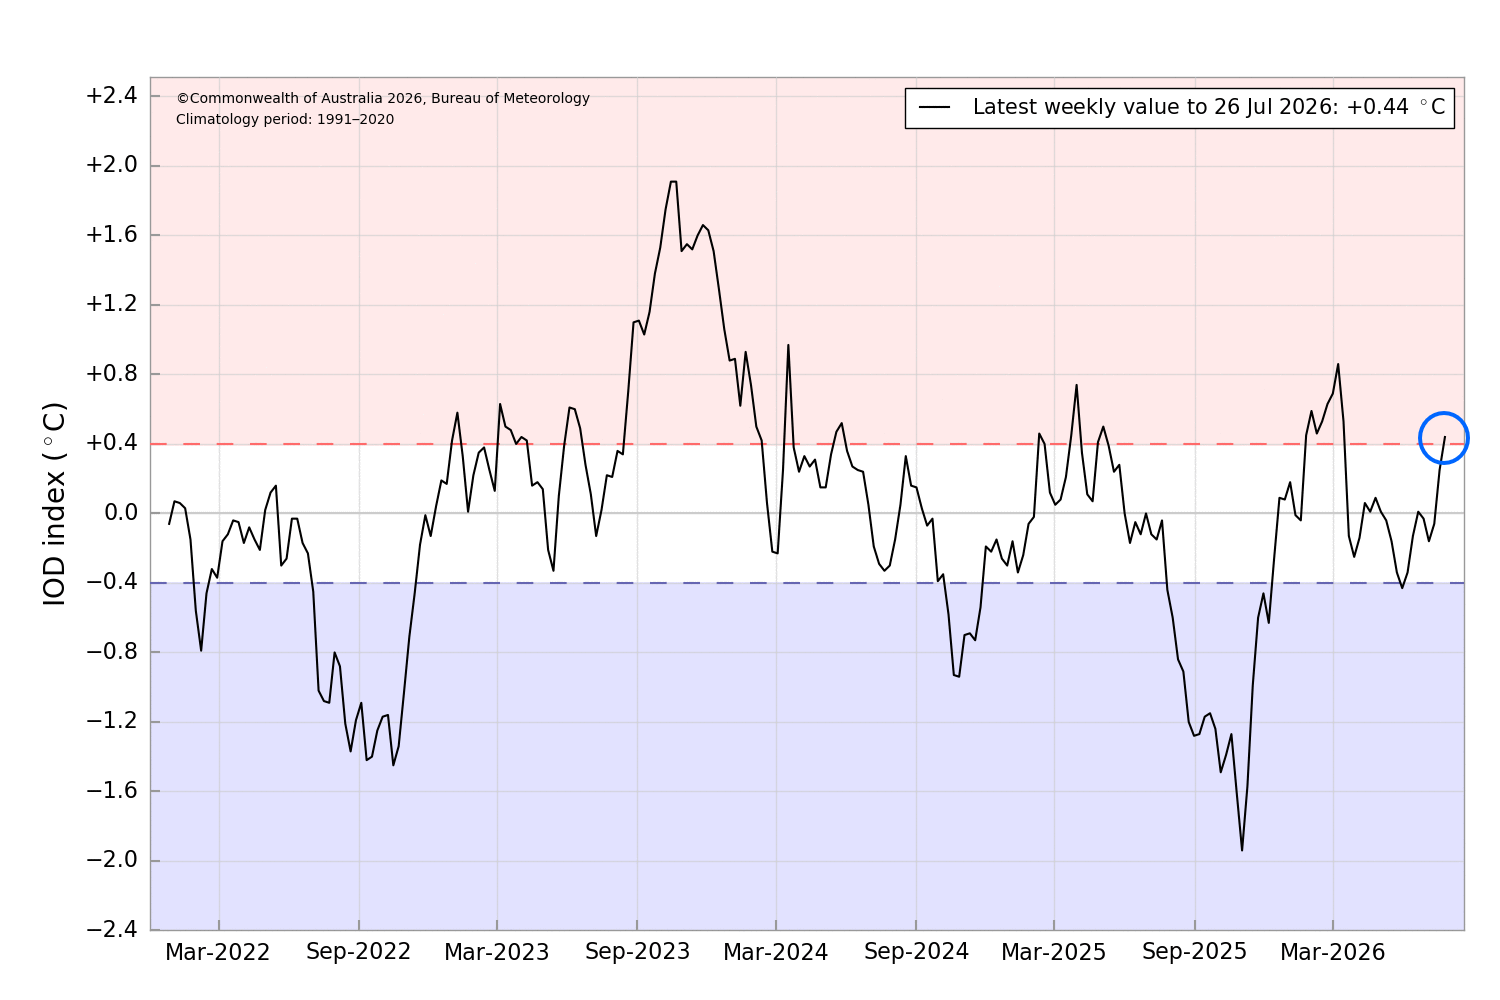
© Copyright Commonwealth of Australia 2026. Bureau of Meteorology.
Pacific Ocean surface wind anomalies
Operational data surface winds 30-day anomaly for Monday 28 June to Tuesday 28 July 2026
During July westerly wind continued in the western Pacific and extended across to the central Pacific. This is becoming more classic in direction, strength and positioning for a textbook El Niño.
In the Indian Ocean in the last week, stronger easterly wind occurred off the island of Java and the ocean has quickly responded, with a cooler blob forming and affecting the Dipole Mode Index value. The wind has returned to normal but expect the patch of cooler water to get bigger over the next week.
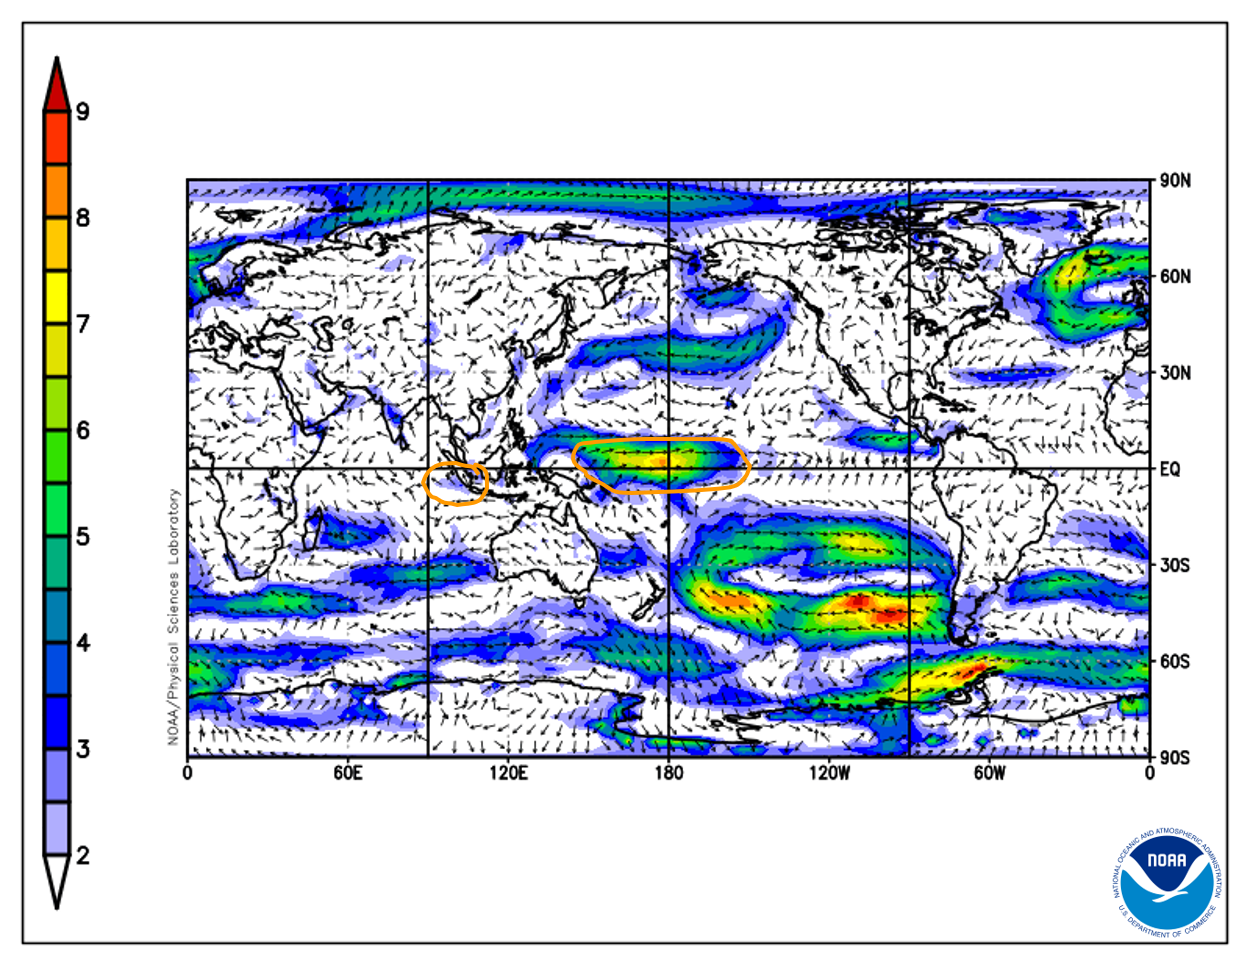
World cloudiness anomalies
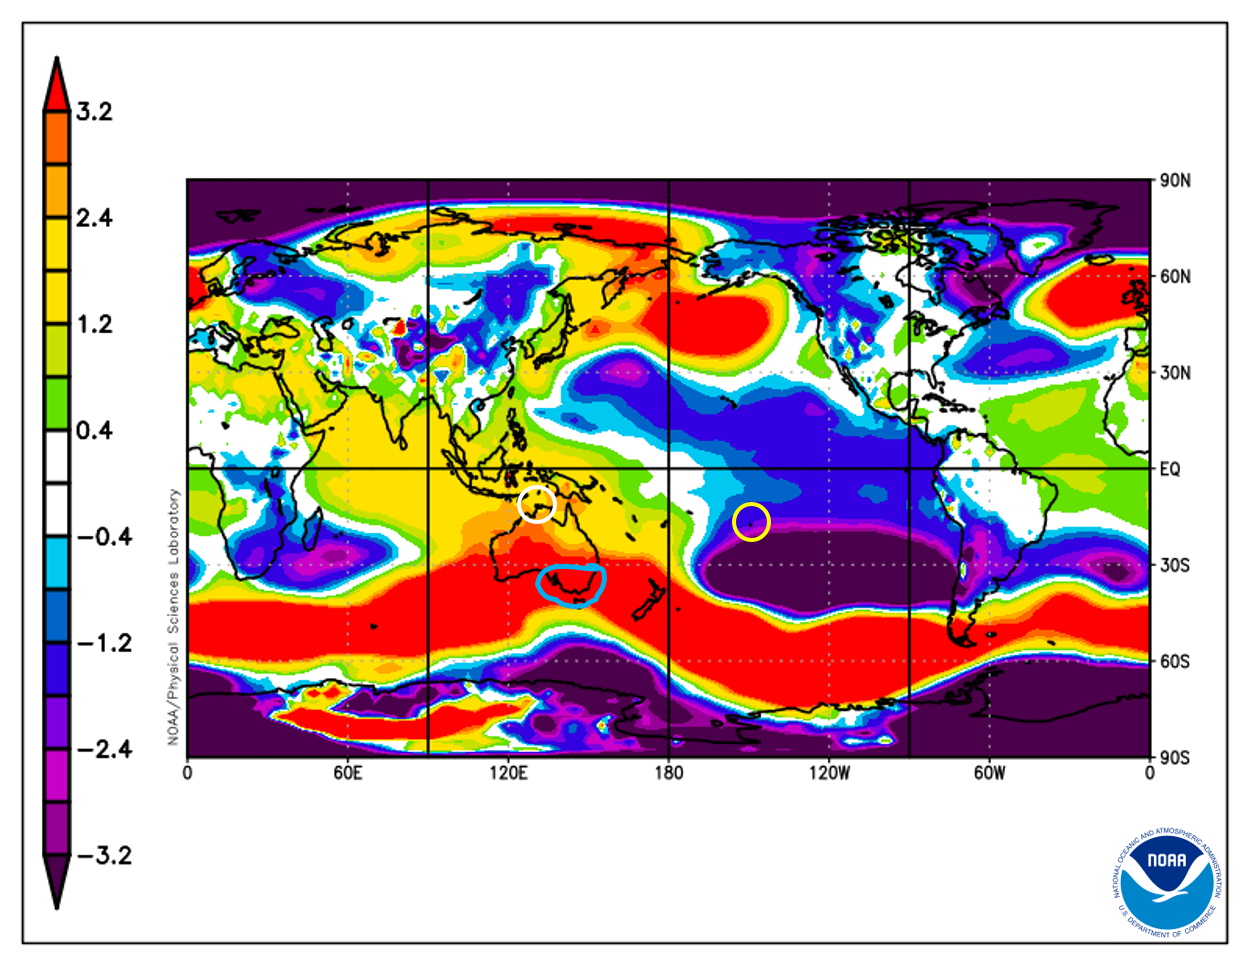
OLR anomalies: Average of 27 June to 27 July 2026
Cloud patterns at the junction of the Date Line and north of Australia are classic El Niño in nature. Greater cloud emanating over the warm water in the western Pacific is balanced by a lack of cloud over PNG and Indonesia.
The Indian Ocean is still showing less cloud across the basin. An eye of less cloud appearing in the southern part of the eastern IOD box is starting to look suspiciously like a +IOD. Less cloud in the off-African box is not in keeping with a coupled +IOD, as the warmer water in this region would normally be showing normal or greater cloud. Some of this lack of cloud is probably due to being in phase 7 and 8 of the MJO.
Source: Bureau of Meteorology.
Southern Annular Mode (SAM)
AAO: observed and GFS forecasts. Observations 31 March to 28 July 2026
The Southern Annular Mode (SAM), or Antarctic Oscillation (AAO), spent July traversing from moderate positivity down to moderate negativity, with most of the month in neutrality. Historically, negative SAM is more common in El Niño years. −SAM usually means systems are pushed closer to southern Victoria, but at the moment higher pressure is in the way more often to stop that occurring. The NOAA model predicts SAM to remain negative, but the BoM model predicts it to return to neutral in the coming 2 weeks.
Source: NOAA.
Madden–Julian Oscillation (MJO)
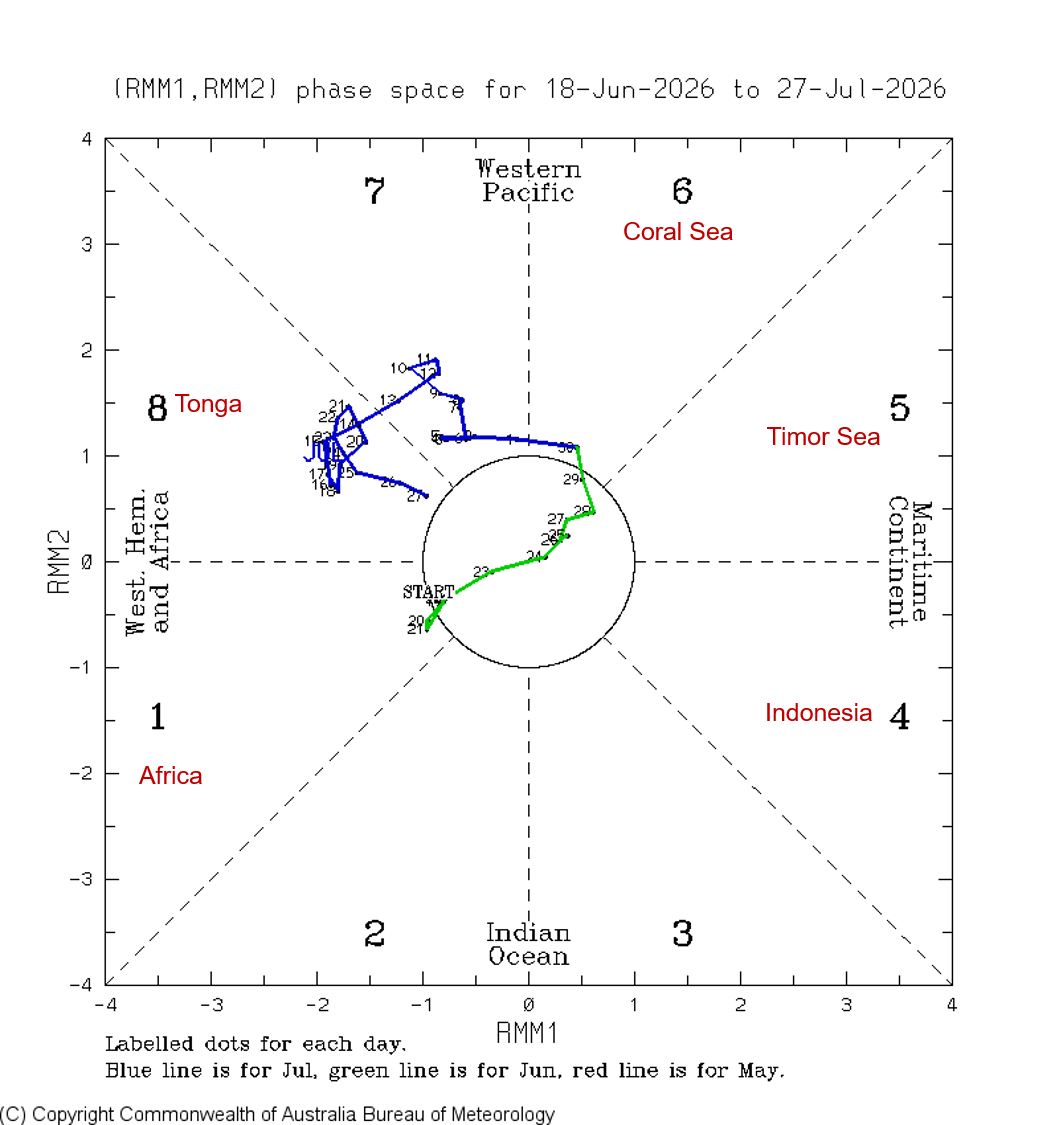
MJO phase diagram for 18 June to 27 July 2026
In the last month the MJO cloud band popped up from nowhere into the Coral Sea and rapidly moved eastwards. It has then sat in limbo for the rest of the month in position 7 and 8, currently in the Western Pacific at Tonga. The MJO is tangled up with the large amount of convection and cloud that’s occurring in that zone due to El Niño. This historically means less cloud over the tropical Indian Ocean.
Over the next 30 days the MJO is predicted to make a rapid transition to positions 4, 5 and 6 in the first week of August. We will see whether this strong burst of activity to our north occurs and can be accessed as a moisture source.
The MJO is a cloud band travelling in an easterly direction just under the equator. It often takes around 40 days to complete a circumnavigation and can be a moisture source when its north of Australia at positions 5 and 6, particularly in winter and spring in Victoria.
Source: Bureau of Meteorology.
Air pressure
Operational data surface winds 30-day anomaly for Monday 29 June to Tuesday 28 July 2026
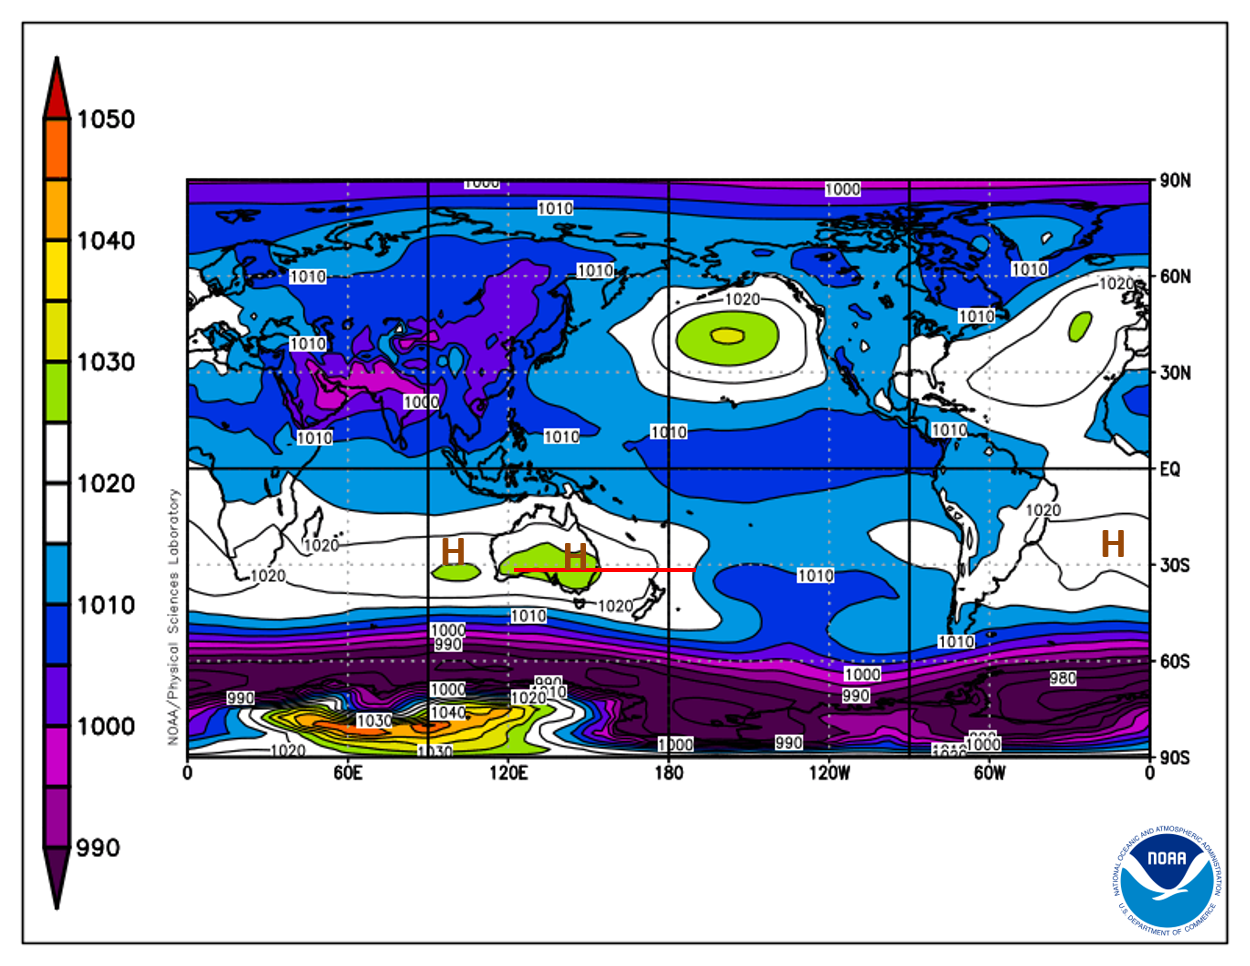
In the past 30 days the Sub Tropical Ridge of High Pressure (STR) has grown in size and intensified over southern Australia. This is essentially a barrier to the passage of storms and fronts across the state. Its latitude at the top of the Bight is a normal position.
Source: BoM.
Air pressure anomalies
Operational data surface winds 30-day anomaly for Monday 29 June to Tuesday 28 July 2026
The Sub Tropical Ridge strengthened over the last month, with higher than normal pressure in a wide band. This was putting downward pressure on rainfall storms and fronts, as pressure systems move slower and are larger. Higher pressure is a classic El Niño method for decreasing rainfall. Much lower pressure in the eastern Pacific measured at Tahiti and higher pressure in the western Pacific measured at Darwin is why the SOI is strongly negative. Higher pressure at Darwin makes it harder to get moisture down from that region. There is higher pressure broadly over the Indian Ocean, not in keeping with a +IOD pattern, which would normally be normal or less off the coast of East Africa.
Source: BoM.
Definitions
Read a list of climate acronyms and explanations.
Modelled climate and ocean predictions for Victoria from May 2026-run models
Twelve climate models show their predictions for the next 6 months for the Pacific Ocean, Indian Ocean, rainfall and temperature for Victoria.
View a colour-coded version of these tables ![]() [MS Word Document - 77.0 KB]
[MS Word Document - 77.0 KB]
Our e-learning module How to read the Fast Break table explains it.
Four coupled global circulation model forecasts
| Phenomenon | System 5 ECMWF Europe | ACCESS-S BoM Australia | SINTEX-F JAMSTEC Japan | CFSv2 NCEP USA |
|---|---|---|---|---|
| Month of run | July | July | July | July |
| Forecast months* | ASO | ASO | ASO | ASO |
| Rainfall skill ASO | Moderate | High/medium far E | – | Moderate N/low S |
| Winter Pacific Ocean NINO3.4 | Warm (El Niño) | Warm (El Niño) | Warm (El Niño) | Warm (El Niño) |
| Winter eastern Indian Ocean | Cool (+IOD) | Slightly cool (weak +IOD) | Slightly cool (weak +IOD) | Slightly cool (weak +IOD) |
| Winter rainfall | Neutral | Drier | Slightly drier | Drier, neutral far E Gippsland |
| Winter temperature | Slightly warmer S, warmer N | Warmer | Slightly warmer | Slightly warmer |
| Forecast months* | NDJ | OND | DJF | NDJ |
| Spring Pacific Ocean NINO3.4 | Warm (El Niño) | Warm (El Niño) | Warm (El Niño) | Warm (El Niño) |
| Spring eastern Indian Ocean | Cool (weak +IOD) | Cool (+IOD) | Cool (weak +IOD) | Warmer |
| Spring rainfall | Slightly drier | – | Neutral | Neutral |
| Spring temperature | Neutral, slightly warmer far E | – | Warmer | Slightly warmer |
| Further info | Operational | Operational | Experimental | Operational |
Four coupled global circulation model forecasts
| Phenomenon | GEOS-S2S NASA USA | EPS JMA Japan | CSM1.1m BCC China | GloSea5 UKMO UK |
|---|---|---|---|---|
| Month of run | July | July | July | July |
| Forecast months* | ASO | ASO | ASO | ASO |
Rainfall skill ASO | N/A | Moderate | Moderate | Poor/moderate central |
| Autumn Pacific Ocean NINO3.4 | Warm (El Niño) | Warm (El Niño) | Warm (El Niño) | Warm (El Niño) |
| Autumn eastern Indian Ocean | Cool (+IOD) | Slightly cool (weak +IOD) | Slightly cool (weak +IOD) | Slightly cool (weak +IOD) |
| Autumn rainfall | Neutral | Drier | Slightly drier, neutral NW | Neutral, slightly drier far E |
| Autumn temperature | Slightly warmer | Warmer | Warmer | Warmer |
| Forecast months* | NDJ | – | NDJ | OND |
| Winter Pacific Ocean NINO3.4 | Warm (El Niño) | – | Warm (El Niño) | Warm (El Niño) |
| Winter eastern Indian Ocean | Slightly warm | – | Slightly warm | Slightly cool (weak +IOD) |
| Winter rainfall | Neutral | – | Slightly wetter W, neutral E | Drier N, neutral S |
| Winter temperature | Slightly warmer | – | Warmer | Warmer |
| Further info | Experimental | Experimental | Operational | Operational |
Three ensembles and a statistical model forecast
| Phenomenon | NMME USA | C3S Europe | MME APCC Korea | SOI phase USQ/Qld Australia |
|---|---|---|---|---|
| Month of run | July | July | July | July |
| Forecast months* | ASO | ASO | ASO | ASO |
| Rainfall skill ASO | Moderate | – | Moderate | – |
| Autumn Pacific Ocean NINO3.4 | Warm (El Niño) | Warm (El Niño) | Warm (El Niño) | SOI negative |
| Autumn eastern Indian Ocean | Slightly cool (weak +IOD) | Slightly cool (weak +IOD) | Cool (+IOD) | – |
| Autumn rainfall | Drier S, slightly drier N | Slightly drier | Slightly drier | Drier, neutral far E Gippsland |
| Autumn temperature | Warmer | Warmer | Warmer | – |
| Forecast months* | NDJ | OND | NDJ | – |
| Winter Pacific Ocean NINO3.4 | Warm (El Niño) | Warm (El Niño) | Warm (El Niño) | – |
| Winter eastern Indian Ocean | Slightly warm | Slightly cool (weak +IOD) | Slightly warm | – |
| Winter rainfall | Neutral N, slightly drier S | Slightly drier | Slightly drier | – |
| Winter temperature | Warmer | Warmer | Warmer | – |
| Further info | Experimental; Summary of 7 dynamic models | Experimental; Summary of 9 dynamic models | Experimental; Summary of 13 dynamic models | 5 phase system based on previous 2 months SOI |
* ASO = August, September, October; SON = September, October, November; NDJ = November, December, January
Image references
Original images used in this document are sourced from the Bureau of Meteorology under a Creative Commons 3.0 licence and from the NOAA which has a public domain policy. Annotations highlighting areas of interest have been added by Dale Grey.