Managing farm water supplies
Water is essential for running a livestock business and has a significant impact upon stock welfare, farm productivity and business profitability.
Knowledge of stock drinking water requirements and potential sources of water are important for planning on both an annual and summer basis.
The goal of farm water planning is to have the water you need, when you need it, where you need it.
Farm water planning should also consider the levels of risk associated with water supply and water quality.
Essential elements of farm water planning include:
- understanding total farm water requirements
- evaluating the quality and quantity of water sources
- measuring and documenting the volume of water storages (dams and or tanks)
- matching stocking rates to water availability
- designing farm water supply and reticulation systems
- determining how long water supplies will last during times of prolonged dry conditions
- understanding changing rainfall, intensity, timing and runoff.
Stock water shortages can be a significant limitation to productivity. A lack of water can mean destocking the property or carting water in, while poor water quality can restrict the type of stock run or inhibit their productivity.
This page is designed to provide information on a range of water requirement and topics along with a series of tips on water management.
Farm water balance
To achieve farm water balance, you require both an adequate supply and adequate on-farm storage. Supply can be sourced from paddocks, and/or roof runoff, bores, rivers or rural pipelines while storage usually involves dams and/or tanks. For a reticulated water supply, it is also critical that the system meets peak demand for animal requirements and has 5 days reserve capacity. One way to determine your overall water needs is to complete a farm water balance or budget. A farm water balance considers:
- water requirements (uses of water)
- water supply on-farm (water available)
- the balance between water supply and use
- storages (actual and potential).
The information provided by the farm water balance along with an understanding of water distribution, quality and seasonal weather patterns can help guide decision making on-farm.
Things such as rainfall intensity, runoff to replenish dams, your increasing demand on water, environmental requirements and downstream users all need to be considered. Other needs to consider are an extended period of no runoff or other supply interruptions.
How much water do you need?
Household
Each person uses about 100,000 litres of water per year, which works out to 274 litres per day. If you take this information and apply it to an average Australian family household of two adults and two children, works out to be about 30,000 litres each month.
Garden
The water use of a garden will depend on the average rainfall, style and size of the garden as well as the type of watering system.
The watering allowance for gardens shown in table 1.0 indicates the supplementary water requirements in different rainfall zones. It allows for a watering period of 15 weeks (mainly over summer) with no watering of garden over the rest of the year. This should be considered when completing your water balance for now and future water use within our current climate.
Table 1. Typical supplementary water requirement (summer period) for gardens
| Watering allowance (litres/m2 annual average) | |||
|---|---|---|---|
| Type | RF* Zone >800 mm | RF* Zone 500 – 800 mm | RF* Zone < 500 mm |
| Native garden (no lawn) | 50 | 100 | 150 |
| Lawn with shrubs | 150 | 300 | 450 |
| Vegetable garden | 300 | 600 | 900 |
*RF = rainfall | |||
Fire fighting
Different areas and local councils of the state have requirements for water to be stored for firefighting purposes. It is also a good time to investigate your fire protection system with a range of automated pumps, sprinklers and gravity-fed systems available. When using water tanks make sure, they are fitted with CFA storz fittings.
Livestock requirements
The amount of water an animal requires will depend on several factors, including:
- the class of animal (a lactating cow will require significantly more water than a dry cow or yearling steer)
- the temperature and season (cattle drink more water in summer and during high temperatures)
- the temperature and season (sheep drink more water in summer and hot days and very little during winter)
- the feed on offer (grains are a dry feed while pasture contains a lot of moisture)
- the quality of the water (water with higher salt levels will increase consumption).
It is important to remember that the peak consumption for your local area could be significantly higher than the figures given.
Table 2. Stock drinking requirements
Livestock unit | Daily average litres/day | Winter litres/day | Summer litres/day | Annual litres/year/head |
| Sheep | ||||
Lactating ewe on dry feed | 10 | 6 | 14 | 3,650 |
Prime lambs on dry pasture | 4 | 2.4 | 6 | 1,460 |
Mature sheep on dry pasture | 6 | 4.2 | 10 | 2,190 |
Prime lambs on green pasture | 1.1 | 0.7 | 1.5 | 400 |
Mature sheep on green pasture | 3.5 | 2.1 | 4.9 | 1,280 |
| Cattle | ||||
Dairy cow, dry | 80 | 48 | 112 | 29,200 |
Dairy cow, milking | 150 | 90 | 210 | 54,750 |
Beef cattle | 80 | 42 | 100 | 29,200 |
Weaners (250-300kg) | 55 | 30 | 70 | 20,075 |
Horses | ||||
Working | 55 | 33 | 77 | 20,075 |
Grazing | 35 | 21 | 49 | 12,775 |
Pigs | ||||
Brood sow | 45 | 27 | 63 | 16,424 |
Mature pig | 20 | 12 | 28 | 7,300 |
Grower (25–90kg) | 12 | 7.2 | 16.8 | 4,380 |
Poultry | ||||
Laying hen | 0.33 | 0.2 | 0.46 | 120 |
Pullet | 0.18 | 0.1 | 0.25 | 65 |
Turkey | 0.55 | 0.3 | 0.77 | 200 |
Alpaca | ||||
Dry | 6 | 3.6 | 8.4 | 2,190 |
Deer | ||||
Dry | 6 | 3.6 | 8.4 | 2,190 |
Goat | ||||
Dry | 4.5 | 2.7 | 6.3 | 1,645 |
Milking | 6 | 3.6 | 8.4 | 2,190 |
A farm water balance can be completed manually using these templates:
- Template 1: How much water you need
- Template 2: How much water you can store.
It can also be completed using the online calculator.
Template 1. How much water you need
Stock drinking water requirements | |||
|---|---|---|---|
Stock type | Number of animals | Litres/year/animal | Total water requirements |
List each type and class of animal run on your property | List maximum number of stock numbers run per year | Refer to table 2.0 Stock water requirements | Multiply number of animals by litres per animal |
Household water use | |||
|---|---|---|---|
House name | Litres/year/person | Number of people | Water use |
| Average water use is 100,000 per person/year in Australia | |||
Garden water use and fire fighting | |||
|---|---|---|---|
Fire fighting tank | Dedicated water supply of at least 10,000 to 20,000 litres | ||
Other farm water uses | |||
|---|---|---|---|
Miscellaneous | |||
How much water do you have?
Water supply for domestic purposes is usually collected in tanks from the runoff from the house and shed roofs. This water supply provides high quality water for drinking, hot water services, washing and various veterinary purposes. There are a wide range of tanks available and careful consideration should be given to their size, type and installation. Gutters and down pipes must be well maintained to ensure maximum rainwater yield.
The amount of rainfall that can be collected depends on the roof area and rainfall and can be calculated by the following formula:
Yr = R x A x F
Where:
Yr = Rainfall Yield in Litres
R = Annual rainfall in mm
A = Area of roof in square metres
F = Factor to account for losses such as evaporation and splashing: Typically, 0.95
Roof catchment area m2
| Annual rainfall (mm) | 150 m2 | 200 m2 | 250 m2 | 300 m2 |
|---|---|---|---|---|
100 | 14,250 | 19,000 | 23,750 | 28,500 |
400 | 57,000 | 76,000 | 95,000 | 114,000 |
600 | 85,500 | 140,000 | 142,500 | 171,000 |
800 | 114,000 | 152,000 | 190,000 | 228,000 |
1000 | 142,500 | 190,000 | 237,500 | 285,000 |
To do the calculations of how much water you have stored across your farm dams at any given time requires you to know how much volume of water you have stored.
To do this you need to know:
- The length (L metres) of the dam at water level
- The width (W metres) of dam at water level
- The depth (D metres) of the dam.
Once you have these measurements you can use the tables 3 and 3.1 to estimate how much water you have in each dam.
Watch this video that shows
Use this clever calculator in summer to keep check on water levels in your dams and tanks and to estimate how long water for stock will last.
Table 3. Volume of water in a small square/rectangular dam (megalitres, ML); Batter slope 3:1
| Water dimensions (metres) | Depth of water (metres) | ||||||
|---|---|---|---|---|---|---|---|
| Length | Width | 0.5 | 1.0 | 1.5 | 2.0 | 2.5 | 3.0 |
| 5.0 | 5.0 | 0.01 | |||||
| 5.0 | 10 | 0.02 | |||||
| 10 | 10 | 0.04 | 0.05 | 0.06 | |||
| 10 | 15 | 0.06 | 0.09 | 0.10 | |||
| 10 | 20 | 0.08 | 0.12 | 0.14 | |||
| 15 | 15 | 0.09 | 0.15 | 0.18 | 0.19 | 0.19 | |
| 15 | 20 | 0.13 | 0.21 | 0.25 | 0.28 | 0.28 | |
| 15 | 25 | 0.16 | 0.27 | 0.33 | 0.37 | 0.38 | |
| 15 | 30 | 0.19 | 0.33 | 0.41 | 0.46 | 0.47 | |
| 20 | 20 | 0.17 | 0.29 | 0.37 | 0.42 | 0.44 | 0.44 |
| 20 | 25 | 0.22 | 0.38 | 0.49 | 0.56 | 0.59 | 0.61 |
| 20 | 35 | 0.31 | 0.55 | 0.72 | 0.84 | 0.91 | 0.94 |
| 20 | 40 | 0.36 | 0.63 | 0.84 | 0.98 | 1.06 | 1.10 |
Table 3.1 Volume of water in a small gully/triangular dam (megalitres, ML); Batter slope 3:1
| Water dimensions (metres) | Depth of water (metres) | ||||||
|---|---|---|---|---|---|---|---|
| Length | Width | 0.5 | 1.0 | 1.5 | 2.0 | 2.5 | 3.0 |
| 5.0 | 5.0 | 0.01 | |||||
| 5.0 | 10.0 | 0.01 | |||||
| 10.0 | 10.0 | 0.01 | 0.02 | 0.03 | |||
| 10.0 | 15.0 | 0.02 | 0.03 | 0.05 | |||
| 10.0 | 20.0 | 0.02 | 0.04 | 0.06 | |||
| 15.0 | 15.0 | 0.02 | 0.05 | 0.07 | 0.09 | 0.11 | |
| 15.0 | 20.0 | 0.03 | 0.06 | 0.09 | 0.12 | 0.15 | |
| 15.0 | 25.0 | 0.04 | 0.08 | 0.11 | 0.15 | 0.19 | |
| 15.0 | 30.0 | 0.05 | 0.09 | 0.14 | 0.18 | 0.23 | |
| 20.0 | 20.0 | 0.04 | 0.08 | 0.12 | 0.16 | 0.20 | 0.24 |
| 20.0 | 25.0 | 0.05 | 0.1 | 0.15 | 0.20 | 0.25 | 0.30 |
| 20.0 | 30.0 | 0.06 | 0.12 | 0.18 | 0.24 | 0.30 | 0.36 |
| 20.0 | 35.0 | 0.07 | 0.14 | 0.21 | 0.28 | 0.35 | 0.42 |
| 20.0 | 40.0 | 0,08 | 0,16 | 0.24 | 0.32 | 0.40 | 0.48 |
| 25.0 | 40.0 | 0.10 | 0.20 | 0.30 | 0.40 | 0.50 | 0.60 |
Template 2. How much water you can store
Water supplies on hand | ||||||
|---|---|---|---|---|---|---|
Water Source | Current Volume (Litres) | Full Supply Volume (Metres2) | Water quality Yes/No | Salinity Yes/No | Catchment size (Hectares) | Comments |
Dam 1 | ||||||
Dam 2 | ||||||
Dam 3 | ||||||
Tank 1 | ||||||
Tank 2 | ||||||
Bore 1 | ||||||
Creek | ||||||
Town Supply | ||||||
Total | ||||||
Sources of water
Water supply can be extremely variable from year to year. Along with the amount of water you may need, consider the quality of water required.
In farm water planning it is important to consider all available sources of water and how much of this water can be stored.
It is important to note that the amount of runoff may not match the amount that you can store. For example, once a water tank or dam fills the water overflows.
There are numerous sources of water and traditionally we have used a catchment dam in a paddock to provide water for stock. With a changing climate, changing farming systems and a greater demand for water, other water sources and means of distribution may need to be considered.
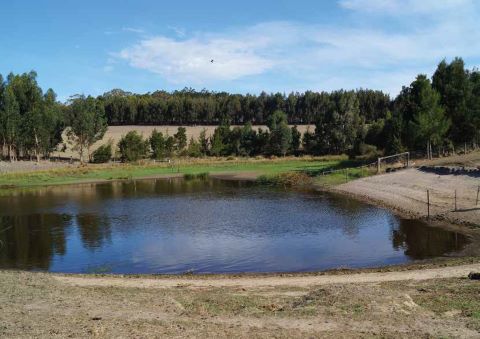
Farm catchment dams
Catchment dams catch and hold water from a defined area and rely on rainfall running into them to fill. Dams require suitable soil characteristics for construction so they seal and hold water. Knowledge and skills are required to ensure placement, design, construction and maintenance of a dam. Many producers rely on small paddock dams to provide water for stock and domestic use. Over recent years these dams have become less reliable due to:
- a hotter and drier climate
- increased stocking rates
- increasing water use from crops or improved pastures leading to less runoff.
A small reduction in rainfall or change in land use can significantly reduce the amount of runoff available for farm dams. Small dams often go dry over summer due to their limited storage capacity and very high evaporation losses. A strategically located large dam can be a valuable investment. It allows for a wider range of management options during periods of low rainfall and runoff. Large deep dams can store enough good quality water for 2 to 3 years supply with little or no replenishment.
Careful planning, design, siting and budgeting is required to implement these larger dams. They require planning approval, careful contractor engagement and site supervision to ensure a quality long lasting drought reserve dam.
For information on detailed technical information to support the planning and construction of farm dams, visit Sustainable Farms.
Bores (shallow and deep)
Access to bore water is gained by drilling a bore hole into the underground acquifer (water storage) and pumping water to the surface. Specialised machinery and knowledge is required to find, develop and install a bore. They require specialized machinery and knowledge to find, develop and install. The water quality and quantity can vary greatly between bores and careful monitoring should take place for both human and animal health.
If you are planning to construct a domestic and stock bore, you will need a bore construction licence; apply for one online at www.waterregister.vic.gov.au/water-trading/my-water or go to your relevant water authority website.
It is recommended that you utilise a licensed driller. You can find a list of licensed drillers at Australian Drilling Industry Association.
Creeks and rivers (licensing generally required)
Animals can have direct access to creeks and rivers for water, or it may be pumped (with a suitable license) to a tank for a water reticulation system. Water quality can depend on creek or river flow rates and quantity can be an issue in dry times.
Pressurised mains system
Large, pressurised pipe systems deliver water across large regional areas to designated points for farmers to access. The sources of water may be large dams (Lake Belfield, Taylors Lake) or the Murray River.
There is a yearly cost for joining onto the system and water is generally supplied via a 19mm pipe with a known pressure. The water flows into a tank that must have an air gap. The air gap creates a physical break in the plumbing system to prevent back flow contamination. Farmers then utilise the water via a water reticulation system (pipes and troughs) for animals to drink from.
Other
There are other types of water systems that can be used on farm such as desalination plants, roaded catchments, water treatment and recycled water. Each of these have their own strengths and weaknesses and should be assessed carefully.
Water reticulation systems
Whilst these water systems are not water sources they should be considered to improve water management on farm. They enable water to be shifted around the farm and provide opportunities for paddock subdivision. Supplying water through troughs can improve water quality for animal health and production as well as minimising losses through evaporation.
Having a tap on the trough will also allow you to clean troughs easily whilst turning troughs off when animals are not in paddock will limit pest animal usage.
Water quality
Water quality considers toxins, sediment, odour, taste, salt content and other elements. Poor water quality can affect plant growth, livestock health, farm equipment and domestic use. The quality of a water source may also vary depending upon weather and external factors such as fires and floods.
Evaporation increases the concentrations of salts while a flash flood dilutes salts but may increase sediment, manure and nutrient runoff. Monitoring should be done regularly and more frequently in summer or in periods of low water levels. Table 4.0 shows some of the elements in water and the tolerance levels of stock.
Table 4. Water quality stock tolerance levels
Element | Rainwater | Upper limit | Effect |
|---|---|---|---|
Calcium | 40 mg/L | >1000 mg/L | Phosphorous deficiency |
Magnesium | 0–19 mg/L | > 1000 mg/L | Scouring and diarrhoea |
Nitrate | 10 mg/L 1mg/L | >1500 mg/L nitrate, | |
>30 mg/L nitrite | Vomiting, convulsions, death | ||
Sulfate | 250 mg/L | >1000–2000 mg/L | Diarrhoea |
Aluminum | 0.05–0.2 mg/L | 5 mg/L | Phosphorous deficiency |
Arsenic | 0.5 mg/L | Diarrhoea, anemia, poor coordination | |
Copper | 1mg/L | 0.5 mg/L | Liver damage and jaundice, Copper accumulation in the liver |
Fluoride | 1 mg/L | >2 mg/L | Tooth damage and bone lesions |
Iron | 0.3 mg/L | Low toxicity | |
Lead (notifiable disease)* | 0.015 mg/L | 0.1mg/L | Reduced coordination, blindness, going off feed |
Molybdenum (related to copper) | 0.15 mg/L | Scouring and loss of condition. Infertility, skeletal disorders, testicular damage | |
pH | 6.5–8.5 | >9 | |
<5 | Other minerals become available such as Copper and Aluminum | ||
Total Dissolved Solids | 500 mg/L | Variable generally | |
> 5000 mg/L | Poor production, diarrhea, higher mortality rates |
Water salinity
Salinity is a major water quality issue in areas where accumulated salts are mobilised in the landscape and make their way into waterways and dams.
Evaporation of these water sources increases the concentration of the salts, and the problems associated with them.
Salinity refers to all the mineral salts present in the water including sodium, calcium, magnesium, chloride, sulphate and carbonate. High salinity levels can make water unsuitable for drinking or irrigation. Electrical conductivity (EC) of water can be used as a measure of salinity. The higher the EC value the higher the salt content. Units are micro siemens/ centimetre (s/cm).
Table 4.1 Salinity tolerance levels for stock water
Type | EC (µS/cm) | mg/L (ppm) | |
|---|---|---|---|
Poultry | Production decline begins | 3,100 | 2,000 |
Pigs | Production decline begins | 3,100 | 2,000 |
Horses | Health / growth affected | 6,250 | 4,000 |
Dairy cattle | Production decline begins | 4,700 | 3,000 |
Beef cattle | Production decline begins | 6,250 | 4,000 |
Lactating Ewes, | Production decline begins | 6,000 | 3,800 |
Sheep dry feed | Production decline begins | 9,300 | 6,000 |
Production decline begins = upper limit salt concentration for healthy growth.
Maximum = maximum salt concentration that may be safe for limited periods.
Seawater = 55,000 us/cm
Rainwater = 100-300 us/cm
Water testing
The best way to be certain about the quality of your water is to have it tested. Check that the laboratory you use is accredited by the National Association of Testing Authorities (NATA) for the test you are requesting. NATA is the authority that provides independent assurance of technical competence through a network of best practice industry experts.
Talking with the laboratory to determine what you need to test for, best sampling methods and costs will help you get the best results of your water quality.
Bores should be monitored at regular intervals for both human and animal health, especially when water levels are dropping.
Conversions
- μS/cm ÷ 1.56 = ppm*
- μS/cm x 0.001 = mS/cm
- mS/m = dS/cm
- 1mg/L = 1ppm = 1g/m3
- 1 ML = 1 000 000 L = 1000 m3
= 1 Megalitre (ML)
= 1 Olympic swimming pool (50 m X 25 m X 2 m) - Seawater = 55 000 S/cm
= 55 mS/cm
= 55 dS/m
Notes
* ppm stands for parts per million, considered the same as milligrams per litre (mg/L)
L = litre,
ML = megalitre
mg = milligram
m3 = cubic metre
mm = millimetre
ha = hectare
μS/cm = microSiemans/centimetre
mS/cm = milliSiemans per centimetre
dS/m = deciSiemens per metre
Farmer tips from past droughts
Have a water plan and undertake a farm water balance, taking into consideration the worst case scenario.
Calculate stock water requirements and water you currently have available.
Assess reliability of all your water sources.
A dam that cannot provide enough drinkable stock water 5 or more years out of 10 is not considered reliable.
Have a large, fenced catchment dam on your property and reticulate from this to troughs.
Plan and develop your reticulation system properly from the start. Do it in stages if necessary. Calculating peak demand, friction loss and flow rates are critical. Water trough siting, and correct installation will all contribute to a highly efficient low maintenance system.
Water loss through evaporation is substantial. If you have a number of shallow dams, think about pumping water to a single dam to minimise evaporative losses.
Decreasing wind velocity across your dam will help to reduce evaporation from dams.
When piping around the farm, remember doubling the pipe diameter will increase the flow rate 4 times.
50mm (2inch) pipe will deliver 4 times the supply compared to 25mm (1 inch) pipe.
Contacts and references
General farm water information
www.agriculture.vic.gov.au/farmwater
Rural water corporations & services
Southern Rural Water
Phone: 1300 139 510 or (03) 5564 1700
Goulburn-Murray Water
Phone: 1800 013 357 or (03) 5826 3500
Grampians Wimmera Mallee Water
Phone: 1300 659 961
Lower Murray Water
Phone: 1800 808 830