Dashboard
Download a printable version of this page: Dashboard ![]() [PDF File - 558.7 KB]
[PDF File - 558.7 KB]
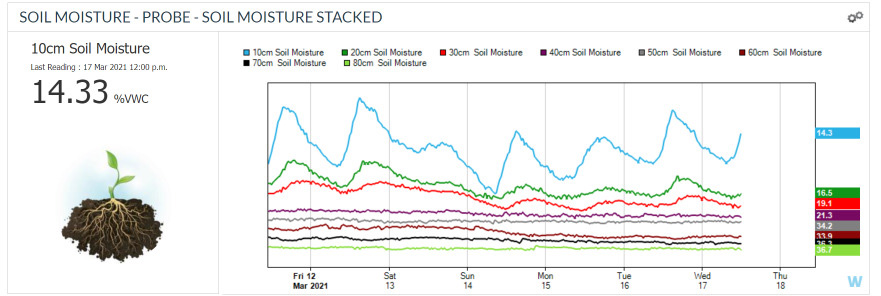
A dashboard is a website or application (app.) that is used to view and interpret real-time data from devices. It can be viewed on a computer, smartphone or tablet.

How does it work?
Dashboards are configured to receive and display data from devices. These devices can monitor information such as water level or electric fence voltage. They connect to the dashboard via a network.
Dashboards can also be used to set thresholds that trigger a response, such as an alert via SMS to your smartphone. In some cases, dashboards can also be used to send a notification to the device, for example it could trigger a solenoid to turn a pump on or off.
Why do I need it?
- A dashboard allows you to view data that is being collected by devices remotely. One dashboard can display information from multiple devices if it’s compatible and configured appropriately.
- While it may be possible to access the raw data from a device without a dashboard, the dashboard offers the benefit of visualising data and displays it simply, using easy to understand icons, graphs and/or tables.
- A dashboard can be viewed by multiple users provided their accounts are connected.
- Dashboards provide flexibility in how data is presented and used. The ability to set thresholds, for example, a low water level for a tank, means you can receive notifications and respond before problems escalate, such as stock running out of water.
How is it used?
Farmers in the South West Victorian demonstration are using Dashboards to…
- Observe electric fence sensors on remote paddocks, saving daily visits by only checking the fence when a notification is received.
- Observe water levels in tanks and troughs and act before water drops to critical levels.
- Record weather data from weather stations on farm for more accurate farm management and decision making.
Things to consider
- Select dashboards that are compatible to your needs and devices. Consider the ability to add more devices to your dashboard in the future.
- More devices may be added to your dashboard using Application Programming Interfaces (API’s).
- Depending on your choice of devices, you may be able to build and maintain your own dashboard.
- Access to the data and where it is stored needs to be considered. Will you be able to access data in the future if needed?
Tech requirements
- Internet access is required to use a dashboard.
- Your smartphone or computer needs to be capable of viewing the dashboard.
Where do I find out more?
About the project
Smart Farm Sensor Demonstrations: This project is supported by Glenelg Hopkins CMA, through funding from the Australian Government’s National Landcare Program, Agriculture Victoria, Grasslands Society of Southern Australia, Southern Farming Systems and Southern Grampians Shire Council. The project runs from 2019-21 to test and demonstrate a range of devices on farms in the south west region, including stock water and tank monitors, soil moisture probes, electric fence sensors and weather stations. The sensors provide real-time feedback to producers enabling them to make more informed decisions and better use of labour, time and capital.