Producer case study: Lloyd Gollop
Lloyd Gollop manages a prime lamb enterprise near Amphitheatre, Victoria. The farm was one of 4 host properties in the ‘Precision soil mapping in central Victorian pastures’ Producer Demonstration Site (PDS) with the Pyrenees and Smeaton BestWool/BestLamb groups. The PDS aimed to demonstrate the potential of grid sampling soil to assess nutrient variability and tailor variable-rate application (VRA) of fertiliser and ameliorants in grazing systems.
Llyod saw the project as a great learning opportunity. ‘Discussions throughout these projects are fantastic – you learn about all sorts of related topics.’
Soil characteristics and nutrient levels across grazing paddocks can be highly variable due to soil type, stock camps, landscape variation, water movement and management. Grid soil mapping provides a one-pass, laboratory analysed method of testing a paddock for variability in pH and nutrient levels. It is currently the most accurate method for developing VRA, which use variable-rate technology to match fertiliser rates to pasture requirements across an entire paddock. This approach is widely used in the cropping industry but has seen limited uptake in grazing systems in central Victoria.
The site provided an opportunity to map the distribution of soil nutrients across 2 neighbouring paddocks, apply a blanket fertiliser rate to one and VRA to the other (targeting an Olsen P of 15) and re-map nutrients 3 years later to demonstrate the impact of VRA within a dynamic livestock system.
The site
The Gollop farm is an undulating landscape featuring granite hills. Average annual rainfall is 500–550 mm. However, during this 4-year project it received a much higher rainfall in 2022 (particularly spring) and experienced a wet summer 2023–24. Traditionally, Lloyd undertakes soil sampling every 4 to 5 years in line with the pasture renovation program, which includes a fodder crop, then straight to a perennial pasture.
Nutrient management traditionally involves a blanket rate of 100kg/ha single superphosphate (SSP) annually, with lime applied every 8 to 10 years. The pasture base across the farm is primarily cocksfoot, fescue and sub-clover, with some phalaris/clover pastures. This is a winter-active pasture system, so throughout the summer period stock are maintained on summer fodder crops with supplementary feeding of grain.

The Gollop demonstration site used VRA technology for phosphorus applications.
Trial paddocks had a winter-active fescue, cocksfoot and sub-clover pasture. The VRA paddock sits immediately above the control paddock within the landscape, as the 2 paddocks were subdivided just prior to the demonstration commencing. This subdivision led to changes in stock movements and sheep camp locations, which in turn had an impact on nutrient redistribution.
The demonstration
Grid-based soil sampling was used to assess variability in soil nutrients across representative grazing paddocks at each of the 4 host farms. All paddocks were grid soil sampled at 0–10 cm depth at a 1 ha resolution (to best understand soil variability per the parameters of this trial) in December 2020. Soil samples were tested for pH (CaCl2), Olsen phosphorus (P), and exchangeable cations (potassium [K], magnesium [Mg], sodium [Na], calcium [Ca]) at an accredited soil laboratory. Subsoil samples were also collected at lower resolution (approximately every tenth grid square, targeted based on initial results) in 0–5 cm, 5–10 cm, 10–15 cm, and 15–20 cm increments to allow for identification of any pH stratification issues.
A producer steering committee developed paddock targets to address limitations to pasture production. Paired-paddock demonstrations were established to compare VRA versus the ‘control’, which involved conventional ‘blanket’ applications of key inputs (phosphorus). Application rates for the conventional applications were determined by the steering committee (using industry standards), based on a single set of soil test results (the paddock average from grid sample points) to achieve the target level.
Similar management was used across the paired paddocks, including similar grazing strategies.
Return soil sampling was undertaken 3 years later (in 2023) to assess any changes in soil conditions.
Pasture composition, feed on offer, stocking rate and pasture quality were monitored throughout the project to assess any impact on livestock and pasture production.
Finally, the benefits and costs of using VRA versus conventional ‘blanket’ (control) applications when applying key pasture inputs were assessed by comparing the costs and relative pasture production (benefits) of the 2 systems.
The Olsen P soil target for the site was 15 mg/kg. Paddock treatments are listed in Table 1.
Table 1: Treatments over 3 years for the control and VRA paddocks
| Year | Control paddock | VRA paddock |
|---|---|---|
| Year 1 | 100 kg/ha SSP | Average of 168 kg/ha SSP |
| Year 2 | 150 kg/ha SSP | Average of 112kg/ha SSP* |
| Year 2 | 102 kg /ha SSP | Average of 67 kg/ha SSP* |
| Total; | 352 kg/ha SSP | Average of 346 kg/ha |
* In years 2 and 3, the decision was made not to apply fertiliser areas in the VRA paddock, which had an initial Olsen P greater than 20 mg/kg. This significantly reduced the maintenance phosphorus used. Maintenance rates for the VRA and control paddocks in Years 2 and 3 were the same apart from these areas. Figure 2 shows annual application maps for the VRA paddock.

Results
Soil test results
Both the control and VRA failed to meet the target Olsen P of 15mg/kg and the average Olsen P dropped in both paddocks. This was exacerbated by an increased stocking rate over the demonstration period (to better manage the fescue pasture), which was not adequately accounted for in the maintenance fertiliser calculations. The VR application failed to reduce paddock variability as sheep continued to transport nutrients to higher points in the landscape.
Control
The control paddock started with an average Olsen P of 11.5 mg/kg (range 7–19 mg/kg) in 2020 and fell to an average of 8 mg/kg (range 5–13 mg/kg) in 2023 (Figure 3).

VRA
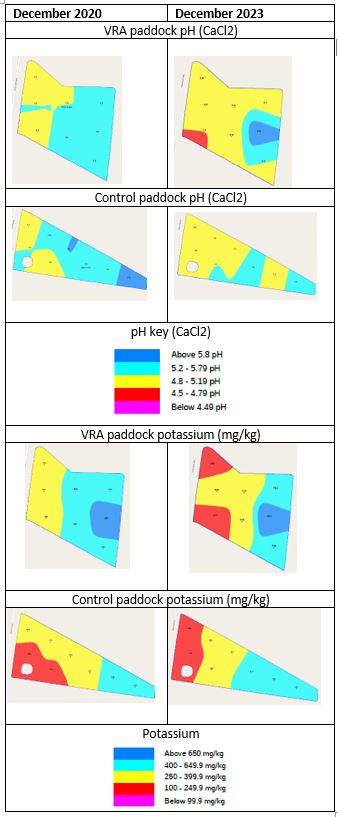
The VRA paddock started with an average Olsen P of 16 mg/kg (range 8–33mg/kg), with the higher levels (yellow and aqua in Figure 3) across a hilltop used as a sheep camp. This dropped during the demonstration to an average of 13 mg/kg, while increasing in variability across the paddock (range 5–38 mg/kg).
Phosphorus levels fell across the whole paddock, except for an area on the hilltop, which increased to an Olsen P of 38 mg/kg. It is likely that the new subdivision fence to the south of the paddock caused a slight shift of the stock camp area.
Distribution of other soil attributes also changed throughout the 3-year demonstration, even though they were not targeted through fertiliser or ameliorant applications. Figure 4 shows changes in pH and potassium, which followed a similar redistribution (to higher points in the landscape) as phosphorus.
Pasture response/production
No consistent difference was measured in pasture production, stocking rate, pasture quality or pasture composition between the control and VRA paddocks at each of the 4 sites throughout the demonstration. The Gollop site grew an estimated 0.9 tDM/ha in the VRA paddock over the 3 years, but this is unlikely to be statistically significant.
Economic outcomes
The economic analysis focused on the costs relative to the pasture production in the VRA and control paddocks. The results presented in Table 2 show that there were large differences in the soil sampling cost between the 2 treatments, with the 8.5 ha VRA paddock equating to $637.50 (compared to a single soil test cost). Commercially in other Central Victorian grazing enterprises, a 2 ha grid size ($40/ha) is most commonly used to best manage testing costs with meaningful and practical VR outcomes.
Table 2: Comparison of 3-year (2021–23) costs and pasture growth of the 2 soil management treatments
Control paddock | VRA paddock | |
|---|---|---|
Total soil sampling cost ($/ha) | $9 | $75 |
Total capital fertiliser cost ($/ha) | $0 | $61 |
Total maintenance fertiliser cost ($/ha) | $136 | $75 |
Total treatment cost ($/ha) | $145 | $211 |
Total 3-year pasture growth (tDM/ha) | 21.0 | 21.9 |
Total treatment cost ($/tDM) | $7 | $10 |
The cost of fertiliser applied was similar between the 2 paddocks, but the VRA paddock had a higher sampling cost, leading to $211/ha compared to $145 for the control paddock for soil testing and fertiliser combined.
These results demonstrate the benefits and costs of additional information. However, in this case the extra information did not lead to improved outcomes, as both the control and VRA failed to hit the target Olsen P of 15 mg/kg and, in fact, moved further away from the target.
Producer feedback
Lloyd was surprised by the drop in Olsen P across control paddock that was spread at his traditional rate of single super, as well as the VRA paddock.
‘We carried more sheep to manage the fescue and it was surprising just how much nutrient was shifted around the paddock, making the sheep camps larger. More nutrient was moved off the paddock at the higher stocking rate as well.
‘The mapping was an expensive exercise, especially at the 1 ha grid size. I’ll probably continue to soil test away from sheep camps in the future. I can soil test and apply nutrients at the lower part of these paddocks and know the sheep will move it up the hill to the camp areas – that’s a savings there.’
Summary
- Grid soil sampling provided detailed soil information and identified variability in Olsen P that aligned to landscape differences and sheep behaviour. Reading the landscape (e.g. identifying sheep camps or different soil types) can help predict variation in soil fertility. Fencing according to landscape changes (e.g. hills or slopes) can reduce variability.
- The increased level of soil information came at an increased cost ($75/ha) compared to the control ($9/ha or $84 for one test).
- Applications of SSP to both the VRA and control (blanket application) fell short of the target Olsen P of 15 mg/kg.
- VRA for SSP did not reduce Olsen P variability. There were a couple of factors, including:
- livestock movement of nutrients into high points in the landscape (stock camps) and the changed fence line
- underestimation of stocking rates on the individual paddocks and therefore maintenance P rates and nutrient movement off the paddocks.
- No obvious or consistent differences were measured in pasture production, quality and composition and stocking rate between the control and VRA paddocks.
- The demonstration highlighted the importance of resampling paddocks over time to understand trends and impacts of applications (and animal movements within paddocks and across the farm).
Note that this site demonstrated VRA for phosphorus only. VRA lime, gypsum and potassium applications were made at other sites with different outcomes.
Acknowledgements
Thanks to Lloyd Gollop (and other site hosts) for allowing the demonstration to be conducted on their property and the Pyrenees and Smeaton BestWool/BestLamb groups for their participation in the project.
For more information, email on-farm-demos@agriculture.vic.gov.au