Victoria’s agriculture and food industries
Overview of Victoria’s agriculture industry
Victoria is a significant producer, processor and exporter of agriculture, food and fibre products. In 2023-24 Victoria’s gross value of agricultural production reached a record high of $22.2 billion, and Victoria's food and fibre exports also reached a record high of $20.1 billion.
Victoria is home to Australia’s largest agriculture and food processing workforce with 150,700 people employed, around 73,000 in agriculture and 77,700 in food and fibre processing (2022-23).
Victoria’s agriculture sector supports 21,300 farm businesses and manages around 11 million hectares, or half of the state’s land (2021–22).
View a map of Victoria’s regions by gross value of agricultural production.
Gross value of agricultural production
Victoria’s estimated gross value of agricultural production (GVAP) is $22.2 billion (in 2023–24). This is 1.9% ($0.4 billion) higher than 2022–23 and is 26% of Australia's total GVAP.
The most valuable farm commodities in Victoria in 2023–24 were:
- grains ($4.6 billion)
- horticulture ($4.6 billion)
- dairy ($3.8 billion)
- beef ($2.9 billion)
- sheep meat ($2.0 billion).
Figure 1: Gross value of agricultural production in Victoria ($billion)
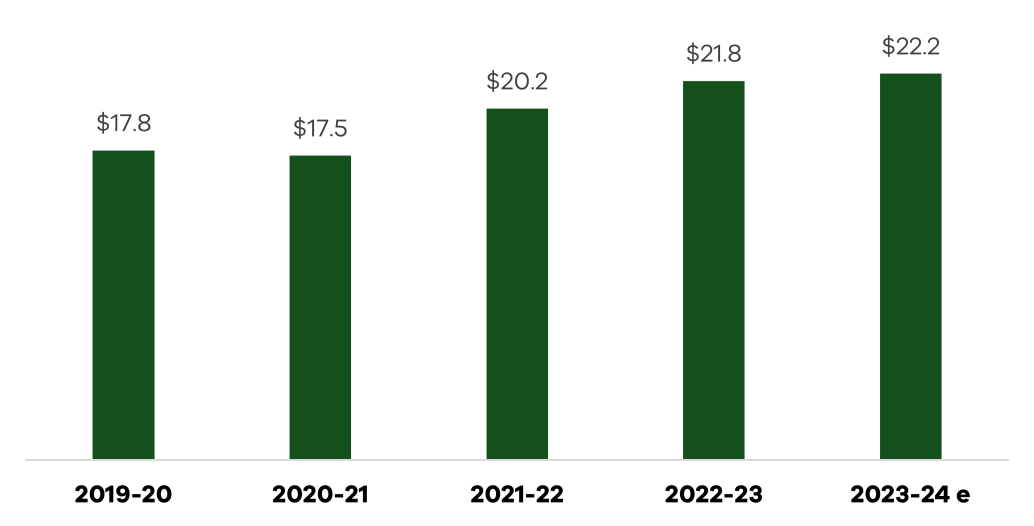
Source: ABS 2025 (livestock, horticulture, broadacre crops) supplemented by analysis by Agriculture Victoria.
Note: e indicates estimate, especially for some minor commodities.
Table 1: Gross value of agricultural production in Victoria
| Commodity | GVAP 2022–23 ($m) | GVAP (e) 2023–24 ($m) | % of total (2023–24) | Change from 2022–23 ($m) | Change from 2022–23 (%) |
|---|---|---|---|---|---|
| Dairy | 3,766 | 3,834 | 17.2 | 68.2 | 1.8 |
| Beef | 2,978 | 2,854 | 12.8 | -124.5 | -4.2 |
| Sheep – meat | 2,044 | 2,048 | 9.2 | 4.4 | 0.2 |
| Wool | 696 | 642 | 2.9 | -54.4 | -7.8 |
| Grains | 4,561 | 4,644 | 20.9 | 83.3 | 1.8 |
| Hay and silage (e) | 674 | 819 | 3.7 | 144.7 | 21.5 |
| Horticulture | 4,332 | 4,619 | 20.8 | 287.3 | 6.6 |
| Nurseries & floriculture | 1,049 | 1,002 | 4.5 | -46.5 | -4.4 |
| Pig | 344 | 405 | 1.8 | 61.3 | 17.8 |
| Poultry – meat and eggs | 1,280 | 1,314 | 5.9 | 33.5 | 2.6 |
| Other livestock | 95 | 63 | 0.3 | -32.0 | -33.7 |
| Total agriculture | 21,819 | 22,244 | 100% | 425.4 | 1.9% |
Source: ABS 2025 (livestock, horticulture, broadacre crops) supplemented by analysis by Agriculture Victoria.
Note: e indicates estimate, especially for some minor commodities.
Agriculture production volumes
In 2023-24, production increased for all farm commodities except wool. Beef had the biggest jump, rising by 31%, or over 117,000 extra tonnes.
Figure 2: Change in production from 2022–23 to 2023–24
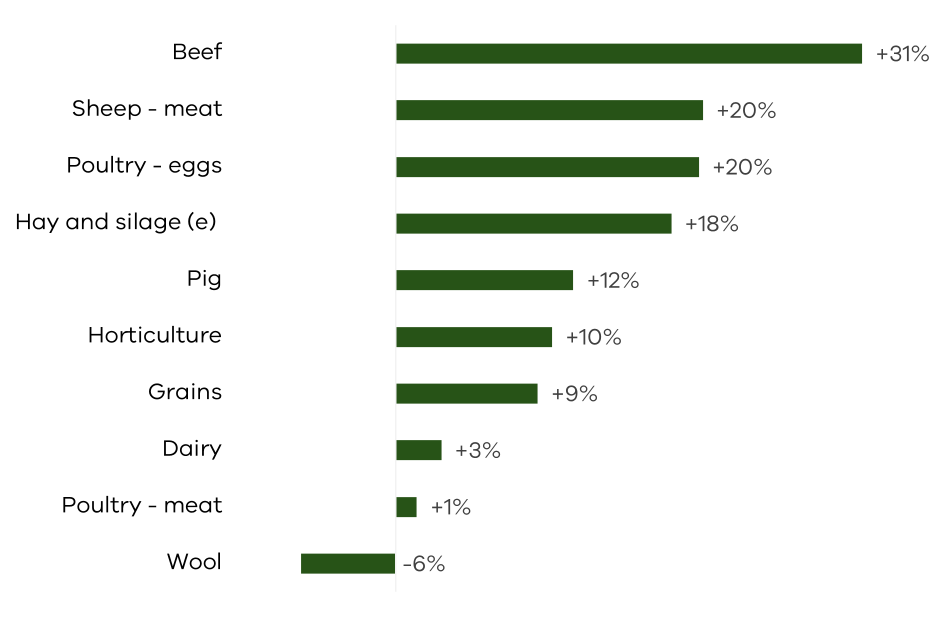
Source: ABS 2025 (livestock, horticulture, broadacre crops); Australian Wool Innovation (2024); Dairy Australia (2025); Eggs Australia (2025).
Note: e indicates estimate.
Table 2: Production by commodity
| Commodity | Unit | 2022–23 | 2023–24 | Unit change from 2022–23 | % change from 2022–23 |
|---|---|---|---|---|---|
| Dairy | L (million) | 5,141 | 5,296 | 155 | 3.0 |
| Beef | tonnes | 380,728 | 498,591 | 117,863 | 31.0 |
| Sheep - meat | tonnes | 367,019 | 441,879 | 74,860 | 20.4 |
| Wool | MKg greasy | 70 | 66 | -4 | -6.3 |
| Grains | tonnes | 9,779,279 | 10,699,132 | 919,853 | 9.4 |
| Hay and silage (e) | tonnes | 3,390,000 | 4,010,105 | 620,105 | 18.3 |
| Horticulture | tonnes | 1,749,508 | 1,931,122 | 181,614 | 10.4 |
| Pig | tonnes | 97,326 | 108,784 | 11,458 | 11.8 |
| Poultry – meat | tonnes | 271,704 | 275,469 | 3,765 | 1.4 |
| Poultry – eggs | dozen ('000) | 108,000 | 129,741 | 21,741 | 20.1 |
Source: ABS 2025 (livestock, horticulture, broadacre crops); Australian Wool Innovation (2024); Dairy Australia (2025); Eggs Australia (2025).
Note: e indicates estimate.
Victoria’s food and fibre exports
Victoria’s food and fibre exports reached a record high of $22.1 billion in 2024–25 – a 10% increase on the previous year. These results cemented Victoria’s position as Australia's largest food and fibre exporter by value, accounting for 28% of the national total.
Victoria's top 5 food and fibre exports are:
- meat ($8.2 billion)
- grain ($4.6 billion)
- dairy ($2.8 billion)
- horticulture ($1.9 billion)
- prepared foods ($1.4 billion).
Victoria's food and fibre export commodities were traded in 174 markets, with China remaining the most valuable market. Victoria’s top 5 food and fibre export market destinations in 2024–25 accounted for around 52% of Victoria’s total food and fibre exports. Ranked by value, they are:
- China ($4.8 billion)
- United States ($3.0 billion)
- Japan ($1.6 billion)
- Indonesia ($1.1 billion)
- New Zealand ($1.0 billion)
Key highlights of Victoria’s food and fibre exports, including a downloadable summary, data tables and an interactive dashboard, can be accessed on Global Victoria’s export page. Support for exporters can be found on our Export page.
Employment
In 2022-23, there were around 150,700 people employed in Victoria’s agriculture and food and fibre processing sectors. This includes around 73,000 in agriculture and 77,700 in food and fibre processing.
Victoria has the largest agriculture workforce in Australia with a 26.3% share, with NSW in second place at 25.6%. More than 85% of employment in agriculture is in regional Victoria.
Figure 3: Agriculture employment by state and territory (total number of jobs, 2022–23)
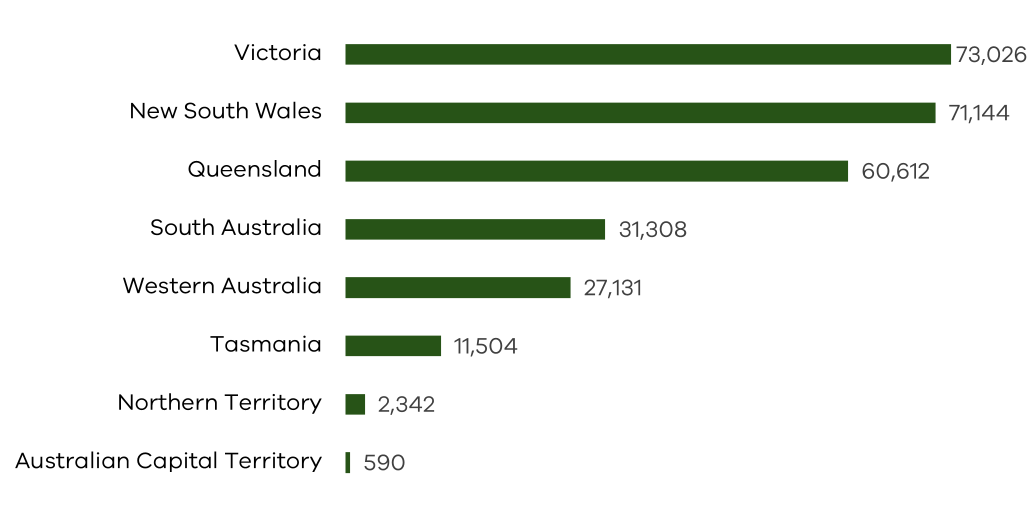
Source: Agriculture Victoria RISE model (2025), informed by ABS (2023) Labour Force Survey.
Figure 4: Agriculture employment in Victoria (total number of jobs, 2022–23)
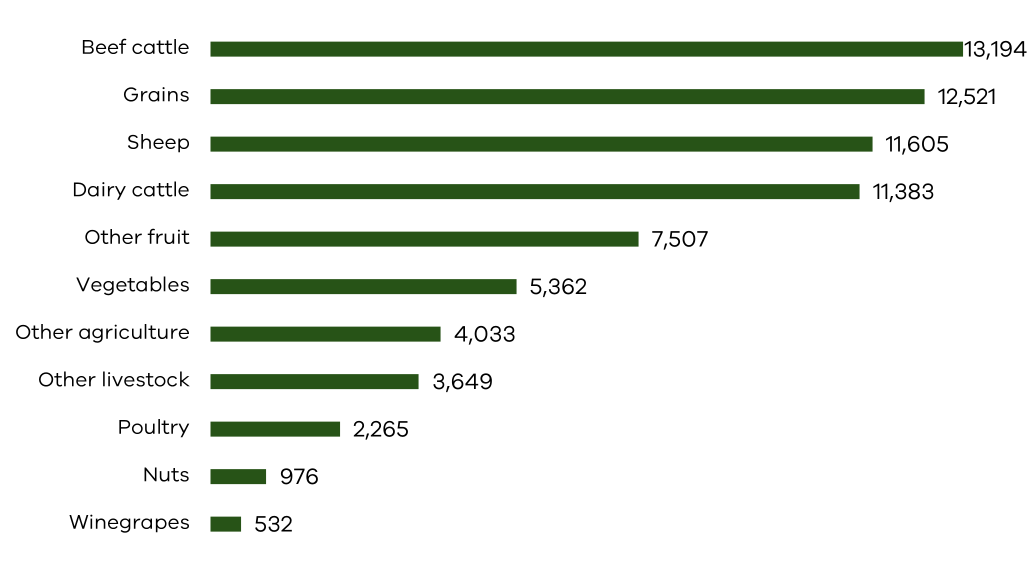
Source: Agriculture Victoria RISE model (2025), informed by ABS (2023) Labour Force Survey.
Note: Other agriculture includes hay and silage, nurseries, turf and cut flowers.
Figure 5: Employment in agriculture and food and fibre processing sectors, as a proportion of total employment by local government area (2021)
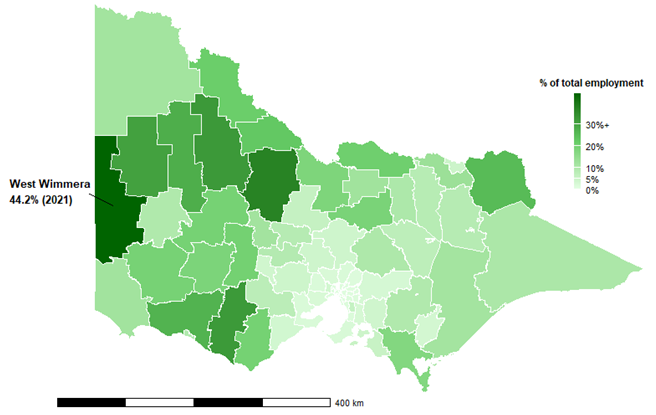
Source: ABS Census (2021)
Table 3: Total employment in agriculture, forestry and fishing (AFF) and food and fibre processing by regional partnership (2022-23)
| Regional partnership | Agriculture, forestry and fishing (AFF) | Food and fibre processing | Total | % of all jobs in the region |
|---|---|---|---|---|
| Barwon | 3,561 | 5,501 | 9,062 | 5.9 |
| Central Highlands | 5,185 | 2,977 | 8,161 | 9.6 |
| Gippsland | 11,133 | 6,396 | 17,529 | 11.9 |
| Goulburn | 9,176 | 4,351 | 13,527 | 15.9 |
| Great South Coast | 10,393 | 3,339 | 13,732 | 19.4 |
| Greater Melbourne | 12,863 | 69,992 | 82,855 | 3.0 |
| Loddon Campaspe | 7,914 | 8,181 | 16,095 | 10.9 |
| Mallee | 10,480 | 2,074 | 12,555 | 19.5 |
| Ovens Murray | 5,362 | 5,081 | 10,443 | 13.8 |
| Wimmera & Southern Mallee | 5,709 | 1,038 | 6,747 | 20.9 |
| Total | 81,777 | 108,930 | 190,707 | 5.3 |
Source: Agriculture Victoria RISE model (2025), based on ABS Labour Force Survey (2022-23).
For a break-down of the industry divisions in Table 3 by industry sub-divisions, refer to Tables 4 and 5 below.
Table 4: Employment in AFF by regional partnership (2022–23)
| Regional partnership | Agriculture | AFF Support Services | Aquaculture | Fishing, hunting and trapping | Forestry and logging | Total |
|---|---|---|---|---|---|---|
| Barwon | 3,063 | 273 | 30 | 83 | 113 | 3,561 |
| Central Highlands | 4,668 | 453 | - | - | 64 | 5,185 |
| Gippsland | 9,876 | 698 | 11 | 114 | 434 | 11,133 |
| Goulburn | 8,404 | 685 | 16 | 26 | 46 | 9,176 |
| Great South Coast | 9,347 | 763 | 20 | 23 | 240 | 10,393 |
| Greater Melbourne | 10,683 | 1,718 | 60 | 108 | 294 | 12,863 |
| Loddon Campaspe | 7,359 | 534 | - | - | 21 | 7,914 |
| Mallee | 9,296 | 1,175 | 2 | - | 9 | 10,480 |
| Ovens Murray | 4,885 | 308 | 2 | - | 167 | 5,362 |
| Wimmera & Southern Mallee | 5,446 | 261 | 1 | - | - | 5,709 |
| Total | 73,026 | 6,868 | 141 | 355 | 1,387 | 81,777 |
Source: Agriculture Victoria RISE model (2025), based on ABS Labour Force Survey (2022–23).
Table 5: Employment in food and fibre processing by regional partnership (2022–23)
| Regional partnership | Food products | Beverage products | Wood products | Pulp, paper and converted paper products | Textile, leather, clothing and footwear | Total |
|---|---|---|---|---|---|---|
| Barwon | 3,119 | 429 | 1,018 | 66 | 869 | 5,501 |
| Central Highlands | 2,134 | 336 | 344 | 2 | 161 | 2,977 |
| Gippsland | 3,597 | 201 | 915 | 1,537 | 147 | 6,396 |
| Goulburn | 3,630 | 357 | 213 | 129 | 22 | 4,351 |
| Great South Coast | 2,854 | 69 | 316 | 3 | 97 | 3,339 |
| Greater Melbourne | 41,587 | 5,914 | 7,212 | 5,466 | 9,814 | 69,992 |
| Loddon Campaspe | 6,732 | 549 | 391 | - | 508 | 8,181 |
| Mallee | 1,144 | 655 | 119 | 54 | 103 | 2,074 |
| Ovens Murray | 2,492 | 949 | 1,166 | 172 | 301 | 5,081 |
| Wimmera & Southern Mallee | 872 | 105 | 25 | - | 36 | 1,038 |
| Total | 68,160 | 9,564 | 11,719 | 7,429 | 12,058 | 108,930 |
Source: Agriculture Victoria RISE model (2025), based on ABS Labour Force Survey (2022–23).
Table 6: Employment in food and fibre, year on year growth and industry proportions
| Industry | Employment in 2022–23 | Growth rate 2021–22 to 2022–23 (%) * | Average CAGRFY16 to FY21 (%) * | % of AFF, 2022–23 | Share of Food and Fibre Processing, 2022–23 (%) |
|---|---|---|---|---|---|
| Agriculture, Forestry and Fishing (AFF) total | 81,777 | 0.9 | 1.3 | 100.0 | |
| Agriculture | 73,026 | 1.7 | 1.0 | 89.3 | |
| AFF Support Services | 6,868 | -2.8 | 5.8 | 8.4 | |
| Aquaculture* | 141 | -32.2 | 1.2 | 0.2 | |
| Fishing, Hunting and Trapping* | 355 | 27.0 | -3.8 | 0.4 | |
| Forestry and Logging | 1,387 | -16.4 | 2.0 | 1.7 | |
| Food and Fibre Processing total | 108,930 | 42.3 | 1.2 | 100.0 | |
| Food Products | 68,160 | 0.3 | 1.9 | 62.6 | |
| Beverage Products | 9,564 | 11.4 | 2.5 | 8.8 | |
| Wood Products | 11,719 | -6.6 | -1.5 | 10.8 | |
| Pulp, Paper and Converted Paper Products | 7,429 | 0.0 | -0.3 | 6.8 | |
| Textile, Leather, Clothing and Footwears | 12,058 | -6.9 | -1.6 | 11.1 | |
| All Food and Fibre Production and Processing | 190,707 | 0.1 | 1.2 |
Source: Agriculture Victoria RISE model (2025), based on ABS Labour Force Survey (2022 and 2023); ABS Census of Population and Housing (2016 and 2021).
* Indicates small sample size. Growth rate 2021–22 to 2022–23 may be unreliable. The Census trend (2016 to 2021) provides a more reliable guide of trends.
View detailed employment statistics by Victorian Regional Partnerships and by jurisdiction:
Farm business numbers
In 2021–22, there were around 21,300 farm businesses in Victoria. The ABS counts a farm as a business if its gross income averages at least $40,000 a year.
Table 7: Number of farm businesses by detailed commodity in Victoria (2020–21)
| Industry (ANZSIC) | Sub-category (ANZSIC) | Number of farms | % of sub-category | % of industry |
|---|---|---|---|---|
| Dairy | Dairy | 3,397 | 15.7 | 15.7 |
| Beef | Specialised (broadacre) | 5,350 | 24.8 | 24.8 |
| Feedlots | 11 | 0.1 | ||
| Sheep | Specialised | 3,627 | 16.8 | 22.3 |
| Sheep with beef cattle* | 1,178 | 5.5 | ||
| Broadacre cropping | Grain growing | 2,212 | 10.2 | 22.0 |
| Mixed cropping (with sheep and/or beef cattle) | 2,181 | 10.1 | ||
| Other broadacre cropping | 360 | 1.7 | ||
| Horticulture (edible, fruit and nuts) | Apple and pear growing | 161 | 0.7 | 7.1 |
| Berry fruit growing | 91 | 0.4 | ||
| Citrus fruit growing | 90 | 0.4 | ||
| Kiwifruit growing | 11 | 0.1 | ||
| Olive growing | 51 | 0.2 | ||
| Stone fruit growing | 172 | 0.8 | ||
| Grape growing | 814 | 3.8 | ||
| Other fruit and tree nut growing | 137 | 0.6 | ||
| Horticulture (edible, vegetables) | Vegetable growing (outdoors) | 561 | 2.6 | 2.9 |
| Vegetable growing (under cover) | 47 | 0.2 | ||
| Mushroom growing | 17 | 0.1 | ||
| Horticulture (amenity) | Floriculture production (outdoors) | 76 | 0.4 | 1.6 |
| Floriculture production (under cover) | 68 | 0.3 | ||
| Nursery production (outdoors) | 106 | 0.5 | ||
| Nursery production (under cover) | 61 | 0.3 | ||
| Turf growing | 30 | 0.1 | ||
| Other livestock | Pigs | 90 | 0.4 | 3.6 |
| Poultry – eggs | 100 | 0.5 | ||
| Poultry – meat | 144 | 0.7 | ||
| Beekeeping | 57 | 0.3 | ||
| Deer | 20 | 0.1 | ||
| Horses | 281 | 1.3 | ||
| Other livestock | 94 | 0.4 | ||
| Total | 21,592 | 100.0 | 100.0 |
Source: ABS (2021) Agriculture Census.
Note: Data on the number of farm businesses that is more recent than 2020–21 is available for dairy and broadacre farming only, via ABARES Farm Data Portal 2025.
Table 8: Number of farm businesses by financial scale (2020–21)
| Financial scale by gross value of agricultural production ($) | Number of businesses | Gross value of production ($ billion) | Business numbers as % | Gross value as % |
|---|---|---|---|---|
| less than 100,000 | 5,842 | 0.3 | 27.1 | 1.8 |
| 100,000 to less than 500,000 | 8,084 | 2.3 | 37.4 | 12.9 |
| 500,000 to less than 1,000,000 | 3,692 | 2.9 | 17.1 | 16.7 |
| 1,000,000 to less than 5,000,000 | 3,682 | 7.7 | 17.1 | 44.1 |
| 5,000,000 or more | 292 | 4.3 | 1.4 | 24.5 |
| Total | 21,592 | 17.5 | 100 | 100 |
Source: ABS (2021) Agriculture Census special order data.
Area and land use
The area of land used for agricultural production in Victoria was 10.7 million hectares in 2021–22, or 48% of the state’s total land. This represents 3% of Australia’s total agricultural land area.
Farm-level economic performance data
For data and information on farm-level economic performance visit Agriculture Victoria's websites for the Dairy Farm Monitor Project and Livestock Farm Monitor Project.