Product choices, embedded emissions and carbon footprint on a Mallee cropping and sheep farm
About Windarra farm
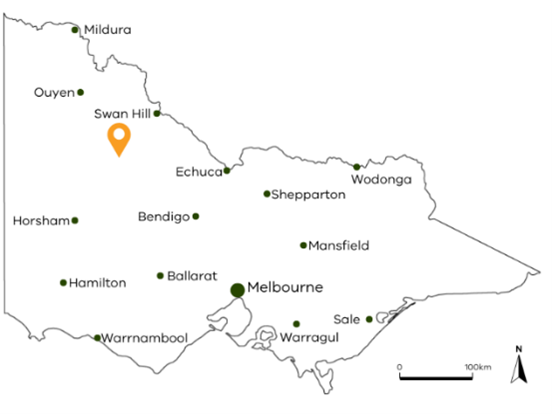
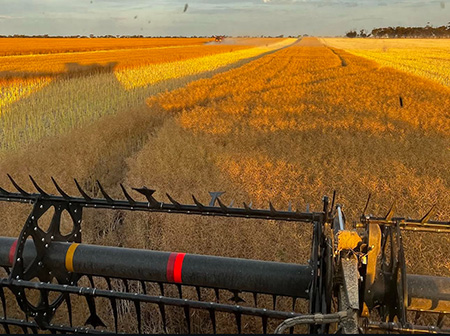
- Tim McClelland and family run a mixed farming enterprise of cropping and sheep in the Southern Mallee, about 28 km north-west of Birchip in western Victoria.
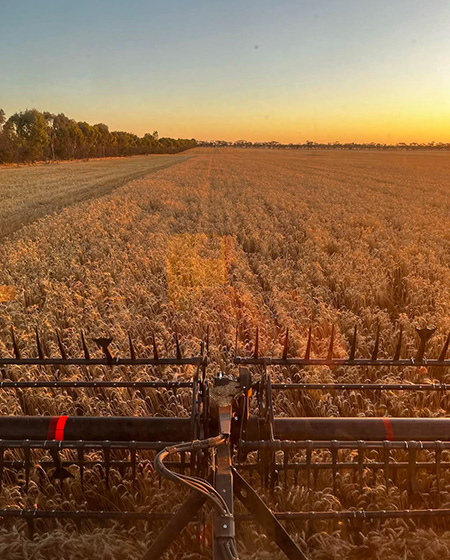
- Windarra consists of 6,548 ha, which includes 80% cropping of dryland wheat, barley, canola, lentil and vetch and cereal hay and 20% livestock.
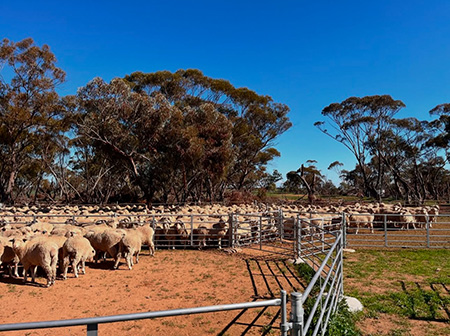
- For livestock, this consists of 3,500 self-replacing Merino ewes.
- About 2,000 ewes are mated to Merino rams for wool and the remaining 1,500 ewes joined to Coopworth/White Suffolk rams for prime lamb production.
- Soil types across the farm are predominantly calcarosols with a mixture of topsoil textures from sandy-loam to clay and alkaline clay subsoils.
- The property has both remnant and recently planted trees, with the goal of planting 500 trees (Mallee gums) every 3 years to progressively increase tree cover.
- In reducing farm emissions intensity, the McClellands are focusing on easy-to-apply options, including optimising livestock monitoring and nutrition and considering inputs.
- The McClellands want to improve their understanding of emissions intensity of the various farm input products they use, so they can make an informed choice to help reduce embedded emissions on their farm.
Farming and carbon emissions
In Australia, there’s a big focus on how farms manage greenhouse gas (GHG) emissions and store carbon. Efficient production to manage and reduce emissions is becoming increasingly important.
Agriculture Victoria’s On-Farm Emissions Action Plan Pilot is working with Victorian farmers to know, understand and act on their farm GHG emissions.
For the McClellands the goal is to have a profitable and sustainable business that balances personal, financial and lifestyle goals with the commercial, ethical and environmental imperatives of the farm.
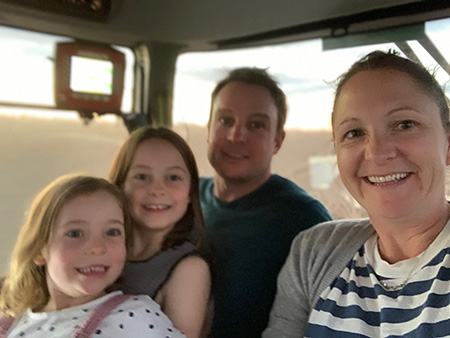
Regarding farm emissions, they consider this an increasingly important issue, where knowledge at the farm level will be vital for understanding where emissions are being generated and whether these can be reduced easily or with difficultly.
Additionally, Tim considers that understanding and reducing the emissions intensity of their production system could potentially be used for market differentiation.
It is clear that the broader society is conscious of emissions associated with the production and consumption of all goods and services. We thought it was important that we start to get an understanding of the emissions associated with all of the aspects of farm production.
The southern Mallee region is characterised by hot dry summers and cold wetter winters where rainfall is variable across seasons. The average annual rainfall for the property is 307 mm.
The McClellands also manage 2 other properties away from Windarra, which provide a means of managing seasonal risk. Results in this case study relate to the Windarra farm only.
Know Your Number
‘Know Your Number’ is a way to measure the greenhouse gas (GHG) emissions from a farm using a special tool like the Greenhouse Accounting Framework (GAF) calculator.
This number is the total amount of carbon dioxide equivalents (CO2-e) produced by the farm each year. It includes three types of emissions, called scopes:
- Scope 1: Emissions from livestock (like enteric methane from sheep and cows), nitrous oxide from nitrogen fertiliser application, urine and dung and carbon dioxide from fossil fuel use.
- Scope 2: Emissions resulting from the electricity the farm uses.
- Scope 3: Emissions created in manufacturing products the farm buys (embedded).
Farms can also capture and store carbon in trees and soils, a process known as carbon sequestration. This captured carbon can be used to balance against their emissions, which is called ‘insetting’.
For the cropping component in 2021, the McClellands found that 50% of their emissions were associated with those embedded in purchased products acquired by the farm (Scope 3). These totalled 1,056 tonnes of CO2-e. Carbon dioxide from energy, fuel and urea made up 27% of emissions and from crop residues was 19% of the cropping program. Nitrous oxide from fertiliser use made up only 4% of total emissions from the cropping enterprise.
For the livestock enterprise, the enteric methane from sheep accounted for 66% of the emissions, while 27% was associated with those embedded in purchased products, where Scope 3 emissions were 884 tonnes of CO2-e. Nitrous oxide from fertiliser, leaching, run-off, urine and dung made up 3% of the total emissions. Carbon dioxide from energy, fuel and urea also made up 3% of total emissions associated with the livestock enterprise.
Across the Windarra farm, the cropping and livestock enterprises accounted for 39% and 61% of the total emissions respectively. There was no insetting of these emissions for the 2021 assessment, as average soil carbon was deemed stable and an estimate of sequestration in trees on the farm could not be conducted due to the full area of tree cover and ages not being available.
For insetting opportunities, the McClellands’ goal is to plant 500 trees over a 3-year period, which will sequester carbon. They also want to use mapping software to assess tree areas and soil samples for carbon analyses. Both these activities will provide baselines for determining future emissions insetting opportunities.
Emissions intensity
Emissions intensity measures the emissions (as CO2-e) per unit of product, reflecting production efficiency. It helps compare farms of different sizes.
The McClelland’s farm emissions intensity for a range of crops, measured in tonnes of CO2-e per tonne of grain produced, was 0.19 for wheat, 0.23 for barley, 0.43 for canola, 0.23 for lentils and 0.41 for field peas. All these emission intensities were within the industry average, except for field peas, which were above the industry average1.
For lamb the emission intensity of sheep meat was 7.7 kg CO2-e per kg of liveweight, which is within the industry average of 6–10 kg CO2-e per kg2. For wool, it was 25.5 kg CO2-e per kg of greasy wool, which is also within industry average of 20–35 kg CO2-e per kg2.
Tim said, ‘It was a pleasant surprise to find out how efficient we were in our production, where in most cases we were at the benchmark for the commodities we produce. In the future, we want to focus on optimising sheep nutrition through rationing across different classes (lambs and ewes) and condition of livestock using more advanced weight monitoring equipment and software. Additionally, we are interested in introducing feed substances that increase productivity and reduce carbon emissions.’
All these strategies will help further decrease the emissions intensity of the livestock enterprise on Windarra farm.
Acting to reduce emissions
Aside from working towards increased production efficiency for livestock, the McClellands also want to gain a better understanding of the embedded emissions contained within products and how product choice influences the emissions intensity of their production.
For Windarra, a major source of emissions was associated with Scope 3 emissions. Tim said, ‘If we knew how emissions-intensive the production of comparative products was, we could pick the product with the lower emissions.’
The future
Tim believes that it will be difficult for the agricultural sector to sequester carbon to entirely inset Scope 1, 2 and 3 emissions, and that the sector will be a net emitter. ‘It is likely we will have to find offsets elsewhere,’ said Tim.
Tim believes that both the farmer and consumer need to share the emissions cost embedded in agricultural products. Tim said, ‘For example, farmers take the emissions when they use urea, but the consumer takes the emissions and pays the cost at the point when they purchase a loaf of bread. If this doesn’t occur, then farmers will end up covering the emissions both upstream and downstream.’
You can’t change what you don’t measure
Finally, regarding the Pilot program and the future, Tim said, ‘You can’t change what you don’t measure. Take the first step to work out what your emissions are, then you can work towards reducing them for the benefit of your production and for the benefit of the planet. Any emissions that we make, which are inefficient, are in effect lowering our production efficiency.’
This case study is part of a series outlining practical actions Victorian farmers are implementing on farm as part of Agriculture Victoria’s On-Farm Emissions Action Plan Pilot program.
Acknowledgements
Author – James Nuttall, Agriculture Victoria, 2024
For further information on the project email actionplanpilot@agriculture.vic.gov.au
The On-Farm Emissions Action Plan Pilot is part of the Victorian Government’s Agriculture Sector Emissions Reduction Pledge to provide practical information, tools and services to support farmers to understand and reduce emissions.
The Pilot will work with up to 250 farm businesses across the state to estimate their on-farm emissions profile and identify potential actions to manage and reduce emissions while maintaining productivity and profitability.
References
1. Greenhouse Gas Farm Monitor Victoria Annual Report 2022–23
Agriculture Victoria has a fact sheet for landowners on some of the key questions to consider when exploring carbon sequestration projects.