Soil survey or soil sampling for irrigated horticulture
Soils and their characteristics underpin the productive potential of agriculture. In irrigated horticulture, it is essential to have an understanding some of these characteristics:
- how water and nutrients are stored, move into, through and out of the soil
- the factors that determine root development and growth.
There are several methods for analysing soil characteristics. Many are referred to interchangeably and understanding the applicability of each is important. Three methods described here are:
- soil pit survey
- electromagnetic induction survey
- soil analysis.
Soil pit survey
A soil pit survey is an important first step in any irrigation development. Soil pit surveys:
- are best practice
- support crop type selection
- support irrigation layout.
They are particularly important in regions with large soil variability such as the Mallee.
Why do I need a soil pit survey?
The variability and characteristics of soils across a property are key considerations when designing an irrigation system. This defines the areas that are suitable for the nominated crop and determines the size and boundaries of irrigation management units.
Soil pit surveys are recognised as a suitable method for identifying this variation. Some key outputs of soil survey include:
- potential rooting depth
- soil profile descriptions
- estimation of Readily Available Water (RAW)
- chemical characteristics (pH, EC)
- soil amelioration recommendations.
Mallee example
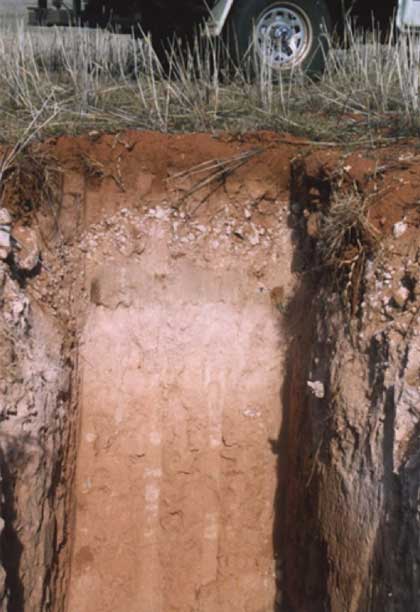 Mallee soils can range from deep sands to heavy clays. They often have a layer of concentrated calcium carbonate within the profile. Deep sands are relatively well drained, whereas clays have low infiltration rates and higher water holding capacity. The presence of clay or hardpan along with poor irrigation design, can promote the formation of perched water tables potentially causing dune seepage and lost productivity in lower-lying areas.
The carbonate layer is also variable, ranging from a fine powder to sheet calcrete. This layer nearly always restricts the potential rootzone depth of the introduced crop and affects drainage. The characteristics and depth of this layer will determine the suitability of different crops, cultivars and rootstock and can vary significantly across a property.
Soil characteristics are used to define management units which ensure plantings are irrigated and managed in like groups according to the:
- water requirements of the crop
- water holding capacity of the rootzone.
On properties with established irrigation systems, a soil pit survey can reveal unexpected information about a property such as:
- greater or lower RAW than expected
- presence of impeding layers which restrict plant performance.
Soil surveys provide a valuable reference for current and future development. They are a long-term investment which provide long term management gains, particularly in irrigation efficiency.
What does a soil pit survey involve?
A soil pit survey consists of a series of backhoe pits throughout a property at a suitable density, dug to a predetermined depth.
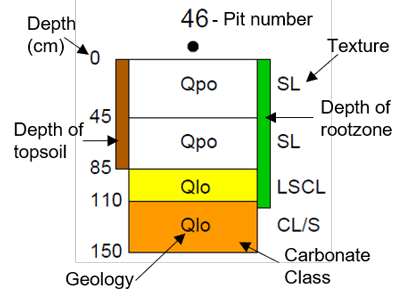 For the Mallee region, backhoe pits are generally:
- spaced at 75m × 75m
- approximately 1 site per 0.56 hectares
- dug to a depth of at least 1.5m.
Pits provide the surveyor access to a fully exposed, undisturbed soil profile (Figure 1).
This survey method describes several soil characteristics including:
- layer depth and field texture
- colour
- carbonate content
- soil structure
- effective rooting depth
- depth of water table
- pH
- salinity.
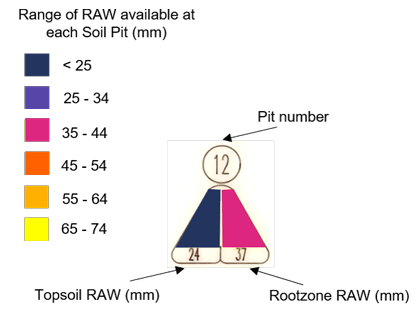 The results of these surveys are presented in a series of maps which summarise the characteristics of the soil profiles in each pit (Figure 2 and 3).
The survey findings presented in these maps include:
- crop suitability (current)
- soil amelioration recommendations
- crop potential (once ameliorated)
- suggested management units
- erosion
- drainage risk.
These maps are accompanied by a written report which provides greater detail about the soil survey process, findings and recommendations.
EM survey
Electromagnetic Induction (EM) survey uses an electromagnetic sensor that measures the electrical conductivity of soil. This survey method:
- is used to identify variability across a field or property
- can be used to initially evaluate land being considered for horticulture.
EM surveys are useful for identifying salinity, water and clay content in soils.
How does it work?
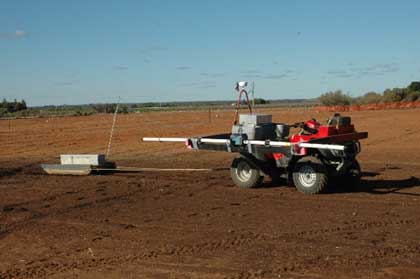 An EM sensor is generally placed inside a sled which is dragged behind an all-terrain vehicle (Figure 4). Readings are taken every few seconds, and with the aid of a GPS unit, precise maps are produced (Figure 5).
The EM sensor uses a receiver and a transmitter coil to measure the transmission of electric currents through the soil. Changing sensor orientation and height above ground level can be used to obtain a range of sensing depths. Different EM instruments have different distances between the coils which also gives different sensing depths.
The strength of currents through the soil are mainly a function of the soil water, clay and salt content. Other factors such as organic matter can also contribute. Each of these factors have interrelated effects on the apparent electrical conductivity (ECa) readings. Readings must be calibrated with soil characteristics to account for the effects of these variables on readings.
Strengths and Limitations
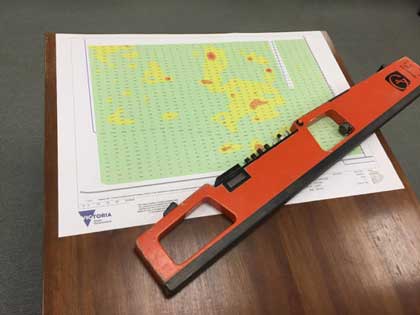 EM surveys are a non-invasive, higher resolution approach to measure soil attributes. These surveys are relatively easy and quick to undertake, which allows growers to repeatedly monitor many sites over an extended timeframe. This can be particularly useful where monitoring salinity is a priority.
Results are highly location and soil specific — soil properties must be clearly understood. Without proper, site-specific calibration, EM surveys can give misleading conclusions.
Therefore, to account for soil characteristics that influence readings:
- soil profiles must be described — as in a soil pit survey
- soil samples taken in conjunction with EM surveys.
The results from calibration are not transferable from one region to another.
There are several properties of Mallee soils which EM surveys cannot determine. These include:
- topsoil depth
- pH
- lime content
- hard pans
- the difference between sandy soil and rock.
Without knowing these properties, correlations between EM readings and soil characteristics cannot be drawn with any degree of confidence. Relying on EM alone, without appropriate soil profile description and analysis, is not recommended.
Agriculture Victoria uses EM38 surveys extensively in north central Victoria as an effective means of measuring rootzone salinity levels for broadacre irrigated agriculture. The information is used to guide farm management decisions.
Soil analysis
Soil is the main source of nutrients for crops. Knowledge of nutrient reserves and their availability to plants are critical for maintaining healthy soil and productivity.
Fertilisers can be a significant component of farm expenditure, so using the correct quantities and form is important. Soil analysis is used to:
- estimate the ability for the soil to provide sufficient mineral nutrients to plants
- understand the mineral balance of the soil
- indicate soil fertility.
Analysis also provides the opportunity to monitor other aspects of soil health which affects the availability of nutrients to crops, such as:
- pH
- electrical conductivity
- organic carbon.
What is measured in a soil analysis?
Soil analysis reports on levels of:
- mineral nutrients
- pH
- electrical conductivity
- the amount of organic carbon.
This generally provides appropriate information to:
- help diagnose poor plant performance
- guide fertiliser regimes
- ameliorate soil constraints which limit nutrient availability.
In established horticultural plantings, it is also useful to undertake a leaf tissue or sap analysis at key growth stages. This is to understand the nutrient status of the trees or vines to further enhance the accuracy of nutrient programs.
Collecting samples for soil analysis
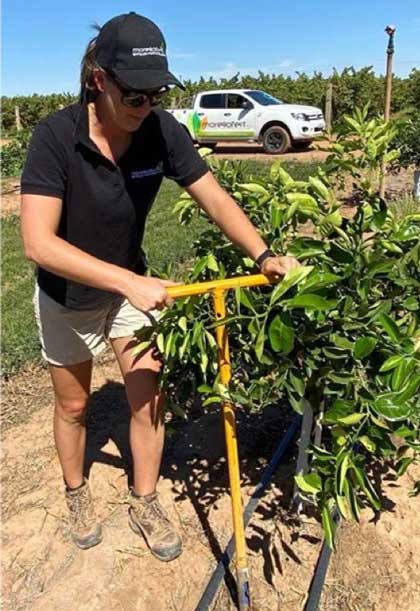 Soil samples must be representative of the management area. Samples should be taken from at least 25 different locations on a block and thoroughly mixed together.
- For unplanted sites, samples are generally taken in a zigzag pattern across the block.
- In young orchards, from the tree row, and in established orchards, halfway between the trunk and dripline (see Figure 6).
A practical demonstration of soil sampling can be viewed online. Although the specific to pasture, the general principles are applicable for horticultural plantings.
Samples should be collected using a corer or spade and taken from a depth of:
- 0–15cm (topsoil)
- 15–30cm (subsoil).
A soil auger can be used to obtain samples from the bottom of the rootzone when testing salinity. Samples are then sent to an accredited laboratory for analysis.
In some regions it can be common to have several types of soil on one property. Significantly different soil types, management units or crop types should be sampled and analysed separately.
Soil analysis can be undertaken as frequently as necessary to inform nutrient management regimes but comprehensive analysis is generally every 3–5 years.
It is important to have the ability to interpret soil analysis data in a wholistic manner, or seek professional agronomic advice to utilise this data to its best potential.
Acknowledgements
- Brian Dunn, NSW DPI, Yanco.
- Kym Luitjes, Sunraysia Environmental.
- Talitha Gollan, Morellofert.