Comparing enterprise performance based on lambing season
Sam Henty, Farm Business Economist, Agriculture Victoria
A commonly asked question is 'how does the timing of lambing effect enterprise performance?'. This article uses data from Agriculture Victoria’s Livestock Farm Monitor Project (LFMP) to investigate the characteristics of beef, wool sheep and prime lamb enterprises lambing and calving across the winter, spring and autumn seasons.
| Calving/lambing season | Enterprise | Stocking rate | Supp. feeding rate | Average sale weight | Price received |
|---|---|---|---|---|---|
| DSE/Ha | ME fed/DSE | kg LWT/hd | $/kg LWT | ||
| Winter | Beef | 16.3 | 277 | 436 | 4.6 |
| Spring | Beef | 17.7 | 297 | 471 | 4.3 |
| Autumn | Beef | 15.2 | 362 | 500 | 4.4 |
| $/kg CWT | |||||
| Winter | Prime lamb | 14.9 | 331 | 49 | 7.2 |
| Spring | Prime lamb | 15.0 | 422 | 50 | 7.8 |
| Autumn | Prime lamb | 9.3 | 476 | 56 | 7.6 |
| $/kg greasy | |||||
| Winter | Wool sheep | 12.3 | 189 | 46 | 11.3 |
| Spring | Wool sheep | 16.2 | 250 | 50 | 14.2 |
| Autumn | Wool sheep | 10.3 | 207 | 51 | 10.4 |
Table 1. Various measures in 2022-23 for enterprises across winter, spring and autumn lambing and calving.
Stocking rate
All autumn calving or lambing enterprises had the lowest average stocking rates. Whereas spring enterprises had the highest stocking rates. Autumn enterprises tended to be in locations where average annual rainfall and carrying capacity were lower than spring and winter enterprises.
Sales and price
There were minimal differences in prices received for beef or lamb across the seasons but for wool there was a large range. This could be the influence of time of lambing on the time of shearing and therefore time of sale, with sales later in the year more exposed to downward price trends experienced across 2022–23. All autumn enterprises had the heaviest average stock sale weights and winter enterprises had the lightest sale weights.
Supplementary feeding
Autumn beef and prime lamb enterprises had the highest reliance on supplementary feed. Their supplementary feeding rates were the highest. Winter enterprises had the least reliance on supplementary feed recording the lowest average supplementary feeding rates across all enterprises.
Comparing risk and gross margins of enterprises
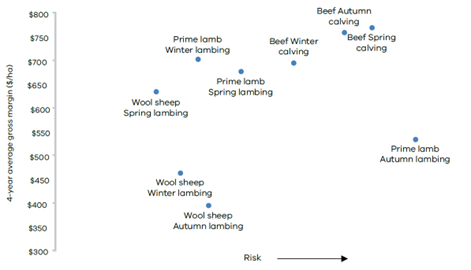
Average gross margins were calculated for each enterprise for each season over the last 4 years. The criteria used to compare the enterprises were the size of 4-year average gross margins (return) and the variability in gross margin over the 4 years (risk).
Risk was measured by the standard deviation in gross margin across the time period 2019–20 to 2022–23. Gross margins that fall toward the right-hand side of Figure 6 are considered riskier than those indicated by points toward the left-hand side.
Autumn and winter calving beef enterprises had the highest average gross margins but were also among the riskiest enterprises. All sheep enterprises were less risky than the beef enterprises except for autumn prime lamb which had the most risk of all enterprises. Prime lamb winter and spring lambing enterprises were the highest gross margins of the sheep enterprises. Both had similar gross margins and risks. Wool sheep spring enterprises had almost half the risk and 40% higher gross margin than wool sheep winter enterprises.
This analysis shows the relationship between risk and return for the different enterprises and different seasons. Enterprises with higher gross margins tended to have higher risk.
Managing the volatility of an enterprise over time is a characteristic of good farm managers. They will choose a seasonal enterprise so the risk-return mix suits their business location, goals and objectives.

Free benchmarking and profit assessment of your farm business
Agriculture Victoria is offering individual sheep, beef and cropping farmers the opportunity to participate in this respected, rigorous and long running benchmarking program. Individual positions are available across Victoria in 2024.
Participation is free and all information is treated as highly confidential.
Each participating farm receives an annual individualised farm report with farm benchmark information from the reporting year as well as all previous years of participation. A participating farm business can use the results from this report to compare itself over time and help identify the critical variables to inform and provide confidence for on-farm decision making. The report is a trusted and unbiased source of information that can assist farm businesses with conversations with the bank, consultants and industry.
‘Had the first serious meeting with the bank today since starting the farm monitor and it was very helpful. I just kept saying, “yep, the data is there and you can see the comparison to the previous year’’. It made something that can be a bloody nightmare so much easier’.
Livestock Farm Monitor participant.
For further information about getting involved, please contact Sam Henty, Farm Business Economist, Agriculture Victoria.
